Word document "How to Graph Implicit Equations"
advertisement
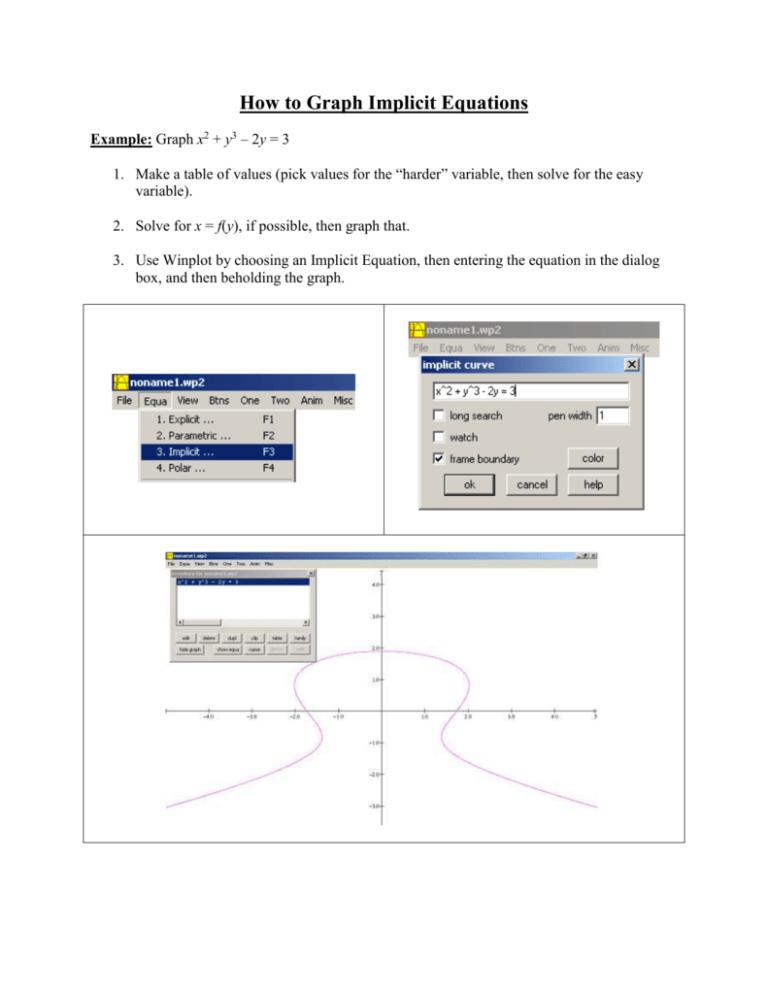
How to Graph Implicit Equations Example: Graph x2 + y3 – 2y = 3 1. Make a table of values (pick values for the “harder” variable, then solve for the easy variable). 2. Solve for x = f(y), if possible, then graph that. 3. Use Winplot by choosing an Implicit Equation, then entering the equation in the dialog box, and then beholding the graph. 4. Use the solve( function on your TI-83. Notice that the calculator doesn’t like you to use the variable Y, the graph is wrong because the solve( function produces one value instead of the 2 or 3 solutions required for some x values, and this graph took 5 minutes to draw. 5. Try to find a parametric expression of the equation. x2 + y3 – 2y =3 x2 =3 + 2y – y3 x = SQRT(3 + 2y – y3) if we let y = t, then x = SQRT(3 + 2t – t3)
