MRoberts Sample Test
advertisement
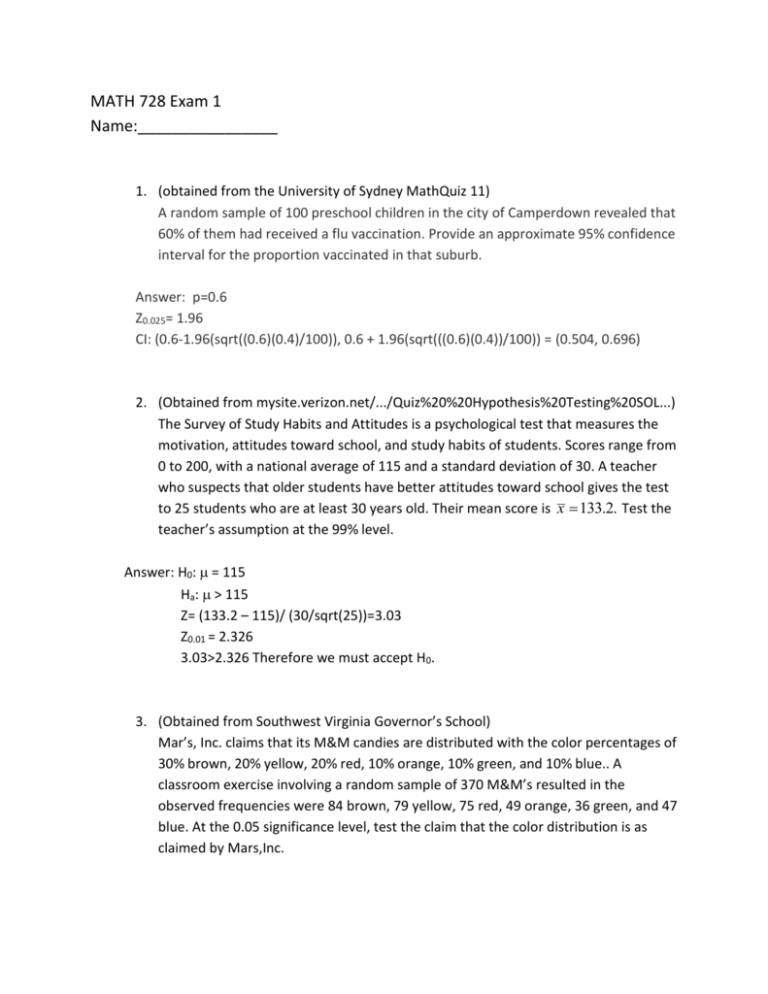
MATH 728 Exam 1 Name:________________ 1. (obtained from the University of Sydney MathQuiz 11) A random sample of 100 preschool children in the city of Camperdown revealed that 60% of them had received a flu vaccination. Provide an approximate 95% confidence interval for the proportion vaccinated in that suburb. Answer: p=0.6 Z0.025= 1.96 CI: (0.6-1.96(sqrt((0.6)(0.4)/100)), 0.6 + 1.96(sqrt(((0.6)(0.4))/100)) = (0.504, 0.696) 2. (Obtained from mysite.verizon.net/.../Quiz%20%20Hypothesis%20Testing%20SOL...) The Survey of Study Habits and Attitudes is a psychological test that measures the motivation, attitudes toward school, and study habits of students. Scores range from 0 to 200, with a national average of 115 and a standard deviation of 30. A teacher who suspects that older students have better attitudes toward school gives the test to 25 students who are at least 30 years old. Their mean score is x 133.2. Test the teacher’s assumption at the 99% level. Answer: H0: = 115 Ha: > 115 Z= (133.2 – 115)/ (30/sqrt(25))=3.03 Z0.01 = 2.326 3.03>2.326 Therefore we must accept H0. 3. (Obtained from Southwest Virginia Governor’s School) Mar’s, Inc. claims that its M&M candies are distributed with the color percentages of 30% brown, 20% yellow, 20% red, 10% orange, 10% green, and 10% blue.. A classroom exercise involving a random sample of 370 M&M’s resulted in the observed frequencies were 84 brown, 79 yellow, 75 red, 49 orange, 36 green, and 47 blue. At the 0.05 significance level, test the claim that the color distribution is as claimed by Mars,Inc. Answer: Q = (84-111)2/111 + (79-74)2/74 + (75-74)2/74 + (49-37)2/37 + (36-37)2/37 + (4737)2/37 = 13.54 Z0.05 = 11.07 Reject H0 since 13.54 > 11.07
