1 - Mathematics

MATH 125 Calculus I
Assignment 1
Due Date: Monday, September 29, 2008
Instructions: Each group of three students should submit one typed report from the group. This report should be well-written, describing the problem, your group's solution, and any pertinent intermediate steps required to obtain that solution. Include mathematical equations and diagrams where relevant. Computations and graphs should be created on you calculator. Your report should include screen shots of graphs, where appropriate. Each of the three group members should be responsible for writing the report for one of the three assignments during the semester. The group member who writes this report should be different from the group members who write the reports for the other projects. List all group members' names and identify the primary writer on your report.
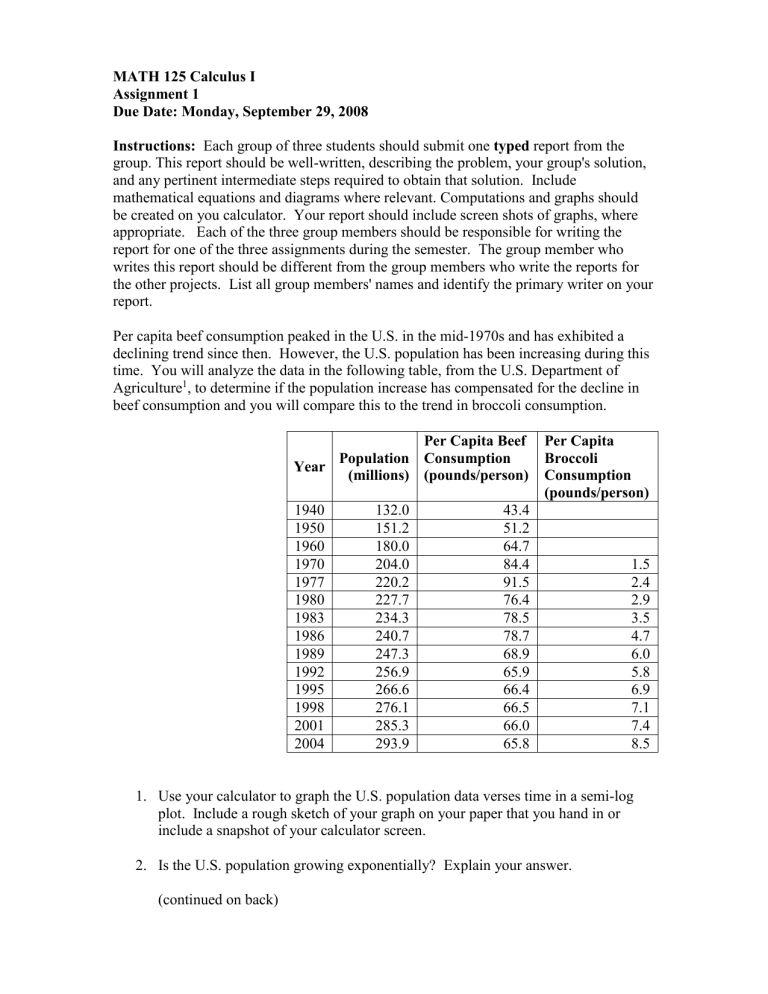
Per capita beef consumption peaked in the U.S. in the mid-1970s and has exhibited a declining trend since then. However, the U.S. population has been increasing during this time. You will analyze the data in the following table, from the U.S. Department of
Agriculture
1
, to determine if the population increase has compensated for the decline in beef consumption and you will compare this to the trend in broccoli consumption.
Year
1940
1950
1960
1970
1977
1980
1983
1986
1989
1992
Population
(millions)
132.0
151.2
180.0
204.0
220.2
227.7
234.3
240.7
247.3
256.9
Per Capita Beef
Consumption
(pounds/person)
43.4
51.2
64.7
84.4
91.5
76.4
78.5
78.7
68.9
65.9
Per Capita
Broccoli
Consumption
(pounds/person)
1.5
2.4
2.9
3.5
4.7
6.0
5.8
1995
1998
2001
266.6
276.1
285.3
66.4
66.5
66.0
6.9
7.1
7.4
2004 293.9 65.8 8.5
1. Use your calculator to graph the U.S. population data verses time in a semi-log plot. Include a rough sketch of your graph on your paper that you hand in or include a snapshot of your calculator screen.
2.
Is the U.S. population growing exponentially? Explain your answer.
(continued on back)
3.
Use exponential regression to find an exponential model for the U.S. population from 1977 to 2004.
4.
Use your exponential model to find the annual percent growth rate of the U.S. population.
5.
Use your calculator to graph the annual U.S. beef consumption per capita verses time in a semi-log plot. Include a rough sketch of your graph on your paper that you hand in.
6.
Is the annual U.S. beef consumption per capita decaying exponentially after
1977? Explain your answer.
7.
Use exponential regression to find an exponential model for the annual U.S. beef consumption per capita from 1977 to 2004.
8.
Use your exponential model to find the annual percent decay rate of the annual
U.S. beef consumption per capita.
9.
Calculate the total annual U.S. beef consumption for each year listed in the table and graph the total consumption verses time.
10.
Does the trend in the total consumption graph relate to the population percent growth rate and the per capita beef consumption percent decay rate? If so, how?
11.
Has the population increase compensated for the decline in per capita beef consumption?
12.
Determine whether or not the annual U.S. per capita consumption of broccoli has grown exponentially. Explain your answer.
13.
Determine whether or not the annual total consumption of broccoli has grown exponentially. Explain your answer.
14.
Use exponential regression to find an exponential model for the annual broccoli consumption per capita from 1970 to 2004. Use this model to find the annual percent growth rate of the U.S. broccoli consumption per capita. Why do you think that the trend in beef consumption and broccoli consumption are so different?
1
Consumer Price Index Home Page, Bureau of Labor Statistics, U.S. Department of
Labor, http://stats.bls.gov/cpi/ .


