Virtual Earthquake Lab 10 24 13
advertisement
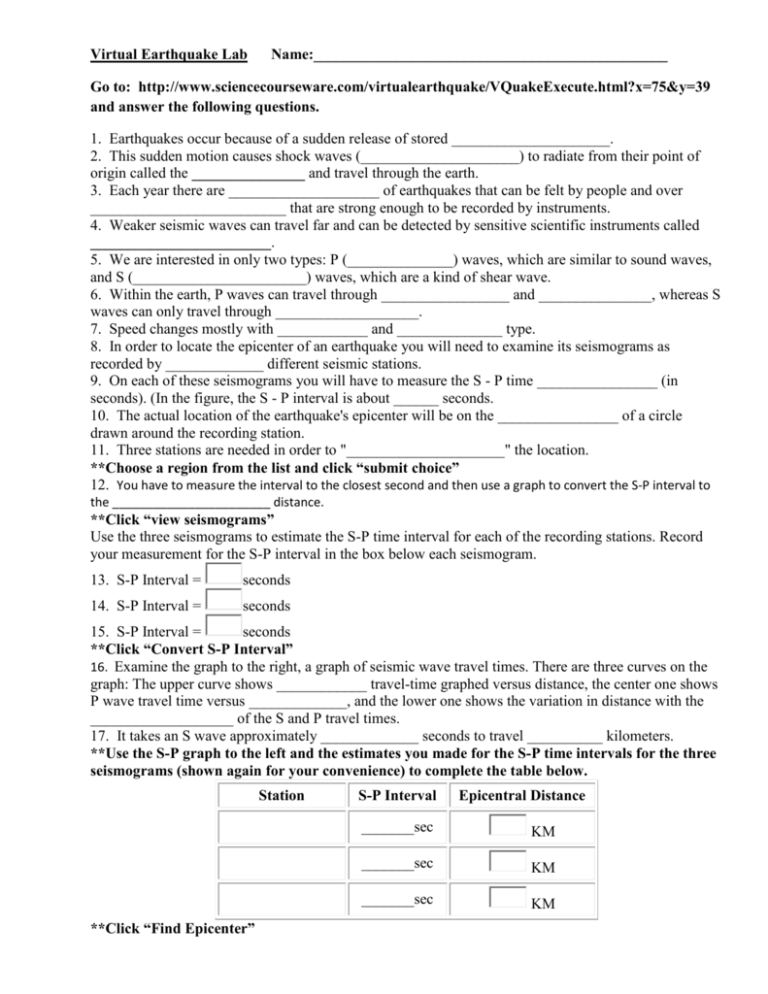
Virtual Earthquake Lab Name:_______________________________________________ Go to: http://www.sciencecourseware.com/virtualearthquake/VQuakeExecute.html?x=75&y=39 and answer the following questions. 1. Earthquakes occur because of a sudden release of stored _____________________. 2. This sudden motion causes shock waves (_____________________) to radiate from their point of origin called the _______________ and travel through the earth. 3. Each year there are ____________________ of earthquakes that can be felt by people and over __________________________ that are strong enough to be recorded by instruments. 4. Weaker seismic waves can travel far and can be detected by sensitive scientific instruments called ________________________. 5. We are interested in only two types: P (______________) waves, which are similar to sound waves, and S (_______________________) waves, which are a kind of shear wave. 6. Within the earth, P waves can travel through _________________ and _______________, whereas S waves can only travel through ___________________. 7. Speed changes mostly with ____________ and ______________ type. 8. In order to locate the epicenter of an earthquake you will need to examine its seismograms as recorded by _____________ different seismic stations. 9. On each of these seismograms you will have to measure the S - P time ________________ (in seconds). (In the figure, the S - P interval is about ______ seconds. 10. The actual location of the earthquake's epicenter will be on the ________________ of a circle drawn around the recording station. 11. Three stations are needed in order to "_____________________" the location. **Choose a region from the list and click “submit choice” 12. You have to measure the interval to the closest second and then use a graph to convert the S-P interval to the _______________________ distance. **Click “view seismograms” Use the three seismograms to estimate the S-P time interval for each of the recording stations. Record your measurement for the S-P interval in the box below each seismogram. 13. S-P Interval = seconds 14. S-P Interval = seconds 15. S-P Interval = seconds **Click “Convert S-P Interval” 16. Examine the graph to the right, a graph of seismic wave travel times. There are three curves on the graph: The upper curve shows ____________ travel-time graphed versus distance, the center one shows P wave travel time versus _____________, and the lower one shows the variation in distance with the ___________________ of the S and P travel times. 17. It takes an S wave approximately _____________ seconds to travel __________ kilometers. **Use the S-P graph to the left and the estimates you made for the S-P time intervals for the three seismograms (shown again for your convenience) to complete the table below. Station **Click “Find Epicenter” S-P Interval Epicentral Distance _______sec KM _______sec KM _______sec KM 18. Triangulation of the Epicenter (write the line following this heading): _________________ **Click “view true epicenter” (or click “remeasure” if you’d like to give it another shot) Complete the table below with the “ACTUAL DATA” numbers that should have gotten: Actual Data Recording Station S-P Interval Epicentral Distance _____sec _____ km _____sec _____ km _____sec _____ km 19. The location of the epicenter determined from your measurements of S-P intervals "should" be at the point ______________ of the three epicentral circles. 20. Among other factors, ________________ in rock types through which the waves travel will change the actual travel times and hence the S-P intervals. **Click “Compute Richter Magnitude” 21. A well-known scale used to compare the strengths of earthquakes involves using the records (the ____________________) of an earthquake's shock waves. 22. The scale, known as the ____________________________, was introduced into the science of seismology in 1935 by Dr. C. F. Richter of the California Institute of Technology in Pasadena. 23. The ____________________ of an earthquake is an estimate of the total amount of energy released during fault rupture. 24. The Richter magnitude of an earthquake is a number: about _______ for earthquakes that are strong enough for people to feel and about _______ for the Earth's strongest earthquakes. 25. The most sensitive seismographs can record nearby earthquakes with magnitude of about ______ which is the equivalent of stamping your foot on the floor. 26. Two measurements are needed: the __________________________________ and the _________________________________ of seismic waves. 27. The blue horizontal grid lines are spaced at _________ millimeter intervals. In this example the maximum amplitude is about ____________ mm. **Click “Go to next page” 28. Although the relationship between Richter magnitude and the measured amplitude and S-P interval is complex, a graphical device (a ____________________) can be used to simplify the process and to estimate magnitude from distance and amplitude. **Click “Go to next page” **Measure the maximum amplitude of the S-wave for each seismogram and record your estimate in the box below the seismogram. 29. Maximum S Wave Amplitude= 30. Maximum S Wave Amplitude= 31. Maximum S Wave Amplitude= **Click “Submit to nomogram” **Below is Richter's nomogram with three lines representing the data you provided. Use this diagram and estimate the Richter magnitude of this earthquake. (Your three lines might not cross at a point on the magnitude scale.) Enter your estimate in the box below the nomogram. 32. My estimate for the Richter magnitude of this earthquake = **Click “Confirm magnitude” Its ACTUAL estimated magnitude was __________. **Enter your information for the certificate. Check the box that says Email Teacher, then enter my email Ashley.potz@cherokee.k12.ga.us . Click “Get certificate” and call me over when you are finished to show me your final data table.
