jane12109-sup-0003-AppendixS3
advertisement
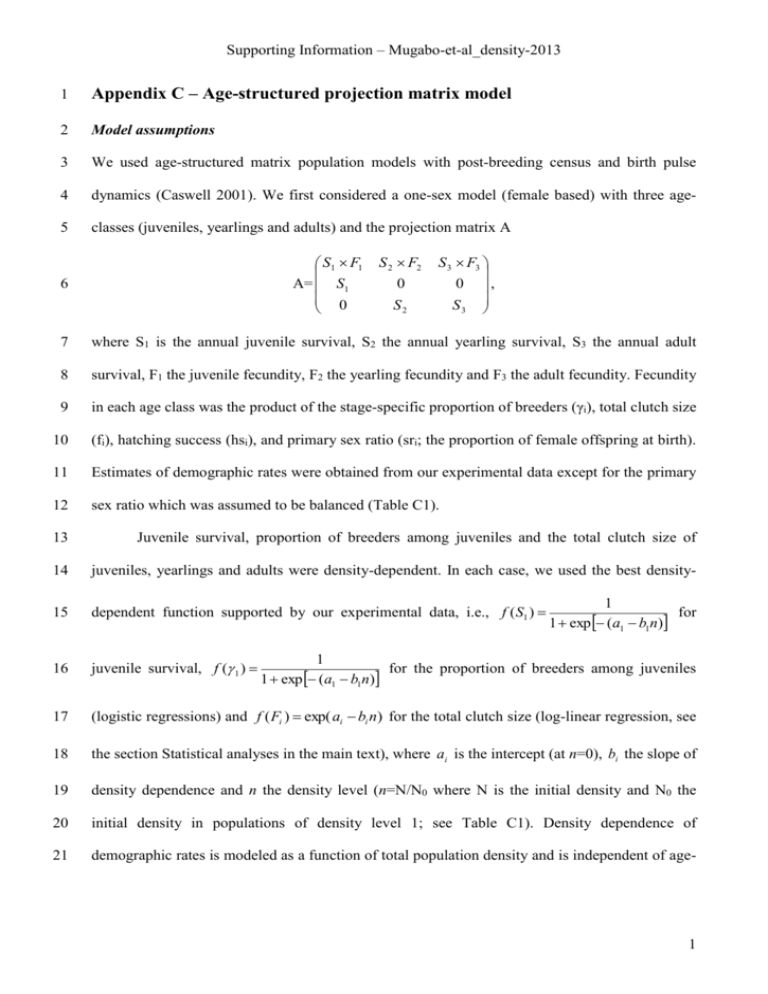
Supporting Information – Mugabo-et-al_density-2013 1 Appendix C – Age-structured projection matrix model 2 Model assumptions 3 We used age-structured matrix population models with post-breeding census and birth pulse 4 dynamics (Caswell 2001). We first considered a one-sex model (female based) with three age- 5 classes (juveniles, yearlings and adults) and the projection matrix A S1 F1 A= S1 0 6 S 2 F2 0 S2 S 3 F3 0 , S 3 7 where S1 is the annual juvenile survival, S2 the annual yearling survival, S3 the annual adult 8 survival, F1 the juvenile fecundity, F2 the yearling fecundity and F3 the adult fecundity. Fecundity 9 in each age class was the product of the stage-specific proportion of breeders (γi), total clutch size 10 (fi), hatching success (hsi), and primary sex ratio (sri; the proportion of female offspring at birth). 11 Estimates of demographic rates were obtained from our experimental data except for the primary 12 sex ratio which was assumed to be balanced (Table C1). 13 Juvenile survival, proportion of breeders among juveniles and the total clutch size of 14 juveniles, yearlings and adults were density-dependent. In each case, we used the best density- 15 dependent function supported by our experimental data, i.e., f ( S1 ) 16 juvenile survival, f ( 1 ) 17 (logistic regressions) and f ( Fi ) exp( ai bi n) for the total clutch size (log-linear regression, see 18 the section Statistical analyses in the main text), where ai is the intercept (at n=0), bi the slope of 19 density dependence and n the density level (n=N/N0 where N is the initial density and N0 the 20 initial density in populations of density level 1; see Table C1). Density dependence of 21 demographic rates is modeled as a function of total population density and is independent of age- 1 for 1 exp (a1 b1n) 1 for the proportion of breeders among juveniles 1 exp (a1 b1n) 1 Supporting Information – Mugabo-et-al_density-2013 22 structure. Starting conditions of the simulations were similar to the release conditions of our 23 experiment. 24 A two-sex version of the density-dependent deterministic model was developed to predict 25 the density and age and sex-structures at equilibrium. The two-sex models assumed a male and 26 female coupled life cycle and a polygynous mating system. In two-sex models, potential breeders 27 of all age classes mated randomly. The number of clutches per generation was calculated 28 according to the mating function M(Nm, Nf)=min(hNm, Nf) where Nm is the number of males, Nf 29 the number of females and h the harem size (here, h=4 ). For the unrestricted harem size, the 30 mating function M(Nm,Nf) is equal to Nf when Nm is > 0 and to 0 when Nm = 0. A harem size of 31 four corresponds to a conservative estimate of the average number of females inseminated by a 32 single breeding male (Fitze et al. 2005). In this case, the number of breeding male is limiting 33 when it is lower than one quarter of the number of breeding females. An unrestricted harem size 34 implies that a single breeding male can inseminate all breeding females from the same 35 population. In this case, the number of males is limiting only when there is no breeding male. 36 Elasticity analyses 37 We carried out density-independent and density-dependent elasticity analyses of λ and Neq for 38 each demographic parameter and slope of density dependence (i.e., elasticities of lower-level 39 parameters and not of matrix elements, Caswell 2001). Elasticities of λ and elasticities of Neq 40 predict the proportional change in λ and in Neq respectively, given a small proportional change in 41 a parameter of the model while all other parameters remain constant (Caswell 2001). 42 Computations were carried out using ULM (Legendre & Clobert 1995). Elasticities of Neq are 43 proportional to elasticities of λ if (i) the population has a stable equilibrium, (ii) density 44 dependence is a function of the total number of individuals within the population, and (iii) 45 density dependence operates in the same way in all age classes (Grant & Benton 2000). Here, 46 only the first two conditions were met. 2 Supporting Information – Mugabo-et-al_density-2013 47 Demographic stochasticity 48 The consequences of population density for the extinction risk were investigated using stochastic 49 one-sex and two-sex models. We performed individual-based simulations by incorporating 50 demographic stochasticity on all demographic events. Survival probabilities, breeding 51 probabilities, mating probabilities, sex at birth and the number of mating events were drawn from 52 binomial distributions while the number of offspring produced was drawn from Poisson 53 distributions. 54 References 55 Caswell, H. (2001) Matrix population models, 2 edn. Sinauer Associates, Sunderland. 56 Fitze, P.S., Le Galliard, J.-F., Federici, P., Richard, M. & Clobert, J. (2005) Conflict over 57 multiple-partner mating between males and females of the polygynandrous common 58 lizards. Evolution, 59, 2451-2459. 59 60 61 62 Grant, A. & Benton, T.G. (2000) Elasticity analysis for density-dependent populations in stochastic environments. Ecology, 81, 680-693. Legendre, S. & Clobert, J. (1995) ULM, a software for conservation and evolutionary biologists. Journal of Applied Statistics, 22, 817-834. 3 Supporting Information – Mugabo-et-al_density-2013 63 Table C1. Parameter estimates for density-dependent and density-independent one-sex and two-sex models. Estimates of the proportion of 64 breeders and hatching success are given on the logit scale f ( xi ) 65 given on the log scale f ( xi ) exp( xi ) (log-linear regression). In the density-independent model, estimates were calculated by pooling data from 66 all enclosures. In the density-dependent model, xi ( n) ai bi n , where ai is the intercept (at n=0), bi the slope of the density dependence and n 67 the density level. Estimates in bold are for females, estimates in italic are for males and other estimates are for both sexes. Demographic rates ( xi ) 1 (logistic regression) and estimates of the total clutch size are 1 exp( xi ) Density-independent model One-sex model Two-sex model Annual juvenile survival (S1) 0.400 0.400, 0.303 Annual yearling survival (S2) Annual adult survival (S3) 0.527 0.281 0.527, 0.191 0.281, 0.164 Density-dependent model One-sex model Two-sex model -0.915 + 0.204 × n -0.915 + 0.204 × n -1.353 + 0.204 × n 0.527 0.527, 0.191 0.281 0.281, 0.164 Juvenile fecundity (F1) Percentage of breeders (γ1) Total clutch size (f1) Hatching success (hs1) -0.393 1.06 0.836 2.120 - 0.986 × n 1.370 - 0.133 × n 0.836 Yearling and adult fecundity (F2-3) Percentage of breeders (γ2-3) Total clutch size (f2-3) Hatching success (hs2-3) 2.290 f2 = 1.915, f3 = 1.923 hs2 = 0.846, hs3 = 0.914 2.290 f2 = 2.281 - 0.133 × n, f3 = 2.310 - 0.133 × n hs2 = 0.846, hs3 = 0.914 68 4

