Water Distribution on Earth
advertisement
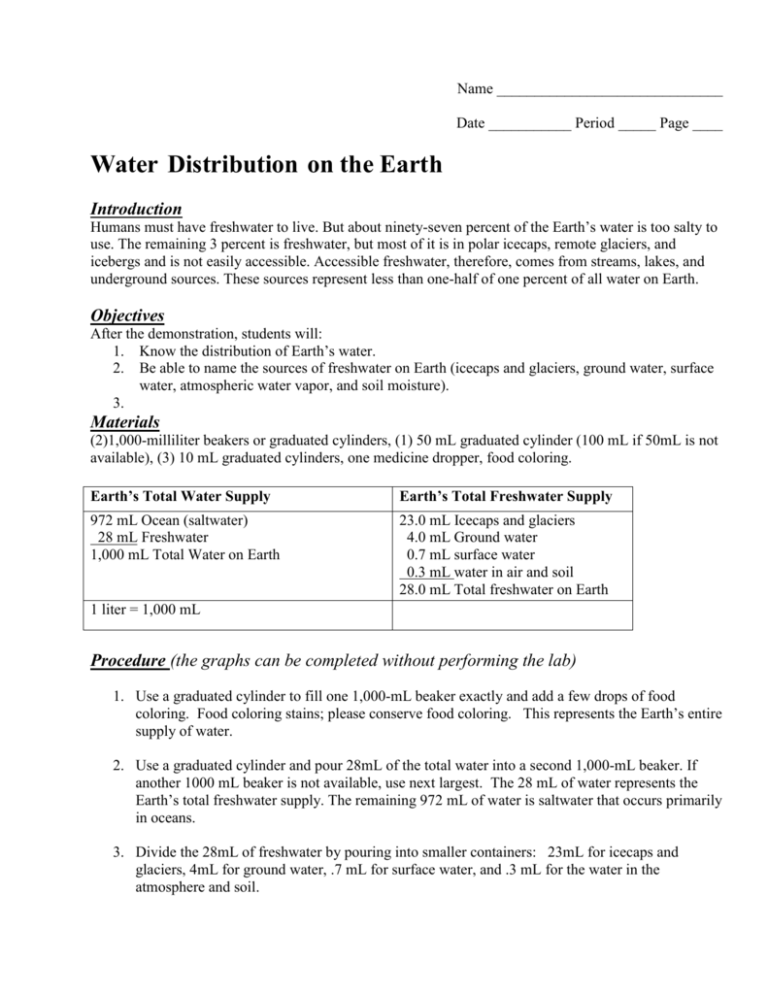
Name ______________________________ Date ___________ Period _____ Page ____ Water Distribution on the Earth Introduction Humans must have freshwater to live. But about ninety-seven percent of the Earth’s water is too salty to use. The remaining 3 percent is freshwater, but most of it is in polar icecaps, remote glaciers, and icebergs and is not easily accessible. Accessible freshwater, therefore, comes from streams, lakes, and underground sources. These sources represent less than one-half of one percent of all water on Earth. Objectives After the demonstration, students will: 1. Know the distribution of Earth’s water. 2. Be able to name the sources of freshwater on Earth (icecaps and glaciers, ground water, surface water, atmospheric water vapor, and soil moisture). 3. Materials (2)1,000-milliliter beakers or graduated cylinders, (1) 50 mL graduated cylinder (100 mL if 50mL is not available), (3) 10 mL graduated cylinders, one medicine dropper, food coloring. Earth’s Total Water Supply Earth’s Total Freshwater Supply 972 mL Ocean (saltwater) 28 mL Freshwater 1,000 mL Total Water on Earth 23.0 mL Icecaps and glaciers 4.0 mL Ground water 0.7 mL surface water 0.3 mL water in air and soil 28.0 mL Total freshwater on Earth 1 liter = 1,000 mL Procedure (the graphs can be completed without performing the lab) 1. Use a graduated cylinder to fill one 1,000-mL beaker exactly and add a few drops of food coloring. Food coloring stains; please conserve food coloring. This represents the Earth’s entire supply of water. 2. Use a graduated cylinder and pour 28mL of the total water into a second 1,000-mL beaker. If another 1000 mL beaker is not available, use next largest. The 28 mL of water represents the Earth’s total freshwater supply. The remaining 972 mL of water is saltwater that occurs primarily in oceans. 3. Divide the 28mL of freshwater by pouring into smaller containers: 23mL for icecaps and glaciers, 4mL for ground water, .7 mL for surface water, and .3 mL for the water in the atmosphere and soil. 4. Construct 2 pie graphs: Percentage of Earth Total Water Supply and Earth’s Total Freshwater Supply (use data on front page). Be sure to show your work on the data table and review Graphing Notes in your notebook. Type of Water Total Water Calculations Fraction Decimal Angle (decimal (Part/Total) times 360°) Type of Water Data Table for Fresh Water Calculations Fraction Decimal Angle (decimal (Part/Total) times 360°) Percent (decimal times 100) Percent (decimal times 100) Interpretative Questions 1. Which of the four freshwater graduated cylinders represents the most freshwater on Earth? 2. Is this a source of freshwater commonly used by humans for drinking, watering the lawn, cleaning, etc.? Explain. 3. Approximately what percentage of the Earth’s fresh water is ground water? 4. Where is most of Earth’s water found? 5. The process for removing salt from ocean water is called desalination. Why isn’t this commonly done? (use notes or textbook) Honors: Is Flagler County considering desalination? Find a news article to support your answer. Print, read, and highlight. Attach article and write APA citiation.
