CIVL253 - HYDROLOGY
advertisement

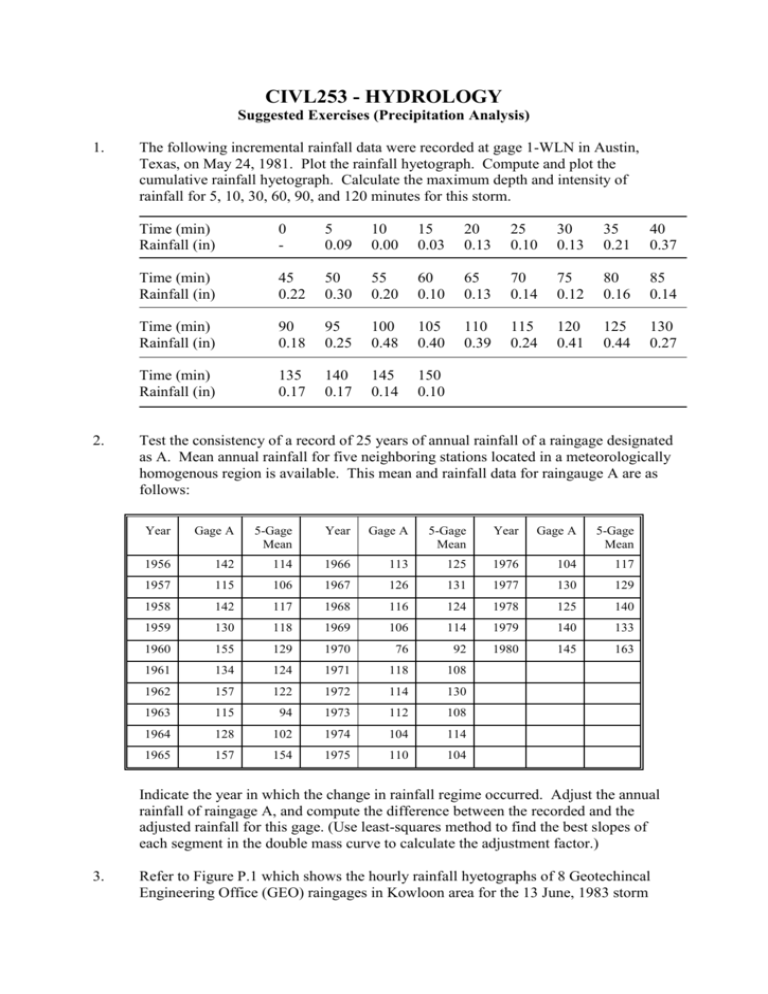
CIVL253 - HYDROLOGY Suggested Exercises (Precipitation Analysis) 1. 2. The following incremental rainfall data were recorded at gage 1-WLN in Austin, Texas, on May 24, 1981. Plot the rainfall hyetograph. Compute and plot the cumulative rainfall hyetograph. Calculate the maximum depth and intensity of rainfall for 5, 10, 30, 60, 90, and 120 minutes for this storm. Time (min) Rainfall (in) 0 - 5 0.09 10 0.00 15 0.03 20 0.13 25 0.10 30 0.13 35 0.21 40 0.37 Time (min) Rainfall (in) 45 0.22 50 0.30 55 0.20 60 0.10 65 0.13 70 0.14 75 0.12 80 0.16 85 0.14 Time (min) Rainfall (in) 90 0.18 95 0.25 100 0.48 105 0.40 110 0.39 115 0.24 120 0.41 125 0.44 130 0.27 Time (min) Rainfall (in) 135 0.17 140 0.17 145 0.14 150 0.10 Test the consistency of a record of 25 years of annual rainfall of a raingage designated as A. Mean annual rainfall for five neighboring stations located in a meteorologically homogenous region is available. This mean and rainfall data for raingauge A are as follows: Year Gage A 5-Gage Mean Year Gage A 5-Gage Mean Year Gage A 5-Gage Mean 1956 142 114 1966 113 125 1976 104 117 1957 115 106 1967 126 131 1977 130 129 1958 142 117 1968 116 124 1978 125 140 1959 130 118 1969 106 114 1979 140 133 1960 155 129 1970 76 92 1980 145 163 1961 134 124 1971 118 108 1962 157 122 1972 114 130 1963 115 94 1973 112 108 1964 128 102 1974 104 114 1965 157 154 1975 110 104 Indicate the year in which the change in rainfall regime occurred. Adjust the annual rainfall of raingage A, and compute the difference between the recorded and the adjusted rainfall for this gage. (Use least-squares method to find the best slopes of each segment in the double mass curve to calculate the adjustment factor.) 3. Refer to Figure P.1 which shows the hourly rainfall hyetographs of 8 Geotechincal Engineering Office (GEO) raingages in Kowloon area for the 13 June, 1983 storm event. From the relative positions of these gages (as shown in the map of automatic raingauges, in class notes), could you tell how the storm move through this area? 4. Refer to Table P.1 containing the information of elevation and mean annual precipitation (MAP) at 25 raingauges in Hong Kong. (1) Plot the MAP (on vertical axis) against elevation (on horizontal axis) and make assessments about orographic effect on precipitation amounts in Hong Kong area. (2) By examining the MAP vs. Elevation plot, what type of model can be used to describe the relationship between them? Then, use the least squares method to determine the model parameters. 5. Refer to Table P.2 showing the annual and monthly correlation coefficients of rainfall amounts at 10 raingauges in Hong Kong area. (1) Identify the locations of the 10 gauges on the map and estimate the distances between each pair of gages (a total of 45 pairs). Then, prepare the distance matrix similar to the correlation matrices as shown in Table P.2. (2) Based on the correlation and distance matrices, construct separately the plots of annual and monthly correlation against distance for the corresponding gage pair. Then, discuss what your observations about the spatial correlation of rainfall amounts in Hong Kong area. 6. Refer to Figure P.2 showing the isohyetal map of rainstorm occurred on July 18, 1992 over the north western New Territory, Hong Kong. The rainfall depths observed at the 5 raingauge stations in the neighbourhood of Basin 9 are given in the following table. Gage Name Yuen Long Tuen Mun Tin Shui Wai Ta Mo Shan Rainfall Depth 280 mm 275 mm 205 mm 420 mm Sheung Shui 235 mm Estimate the aerial average rainfall depth the storm event by (a) arithmetic average method; (2) Thiessen polygon method; and (3) isohyetal method. 7. Referring to Figure P.1, the total rainfall depths corresponding to each of the 8 GEO raingauges in Kowloon area for the 17th June 1983 storm event are listed below. (1) Propose a technique to evaluate the relative performance (in term of estimation accuracy) of the following methods for estimating the missing rainfall at a point: (a) arithmetic average method; (b) normal ratio method; and (c) inverse distance method with the exponent value b=1. (2) Carry out your proposed performance evaluation technique by using the 8 GEO gauges in Kowloon area and draw your conclusions. Sta. Code Station Name Rainfall (mm) K01 K02 K03 K04 K05 K06 K07 Ho Man Tin Lung Cheong Court Sau Mau Ping Jordan Valley Yau Tong So Uk Tsz Wan Shan 249 234 291 291 371 276 224 K08 Lam Tin 357 Figure P.1


