Supplementary Figure -- Comparison of measures of similarity A B C
advertisement

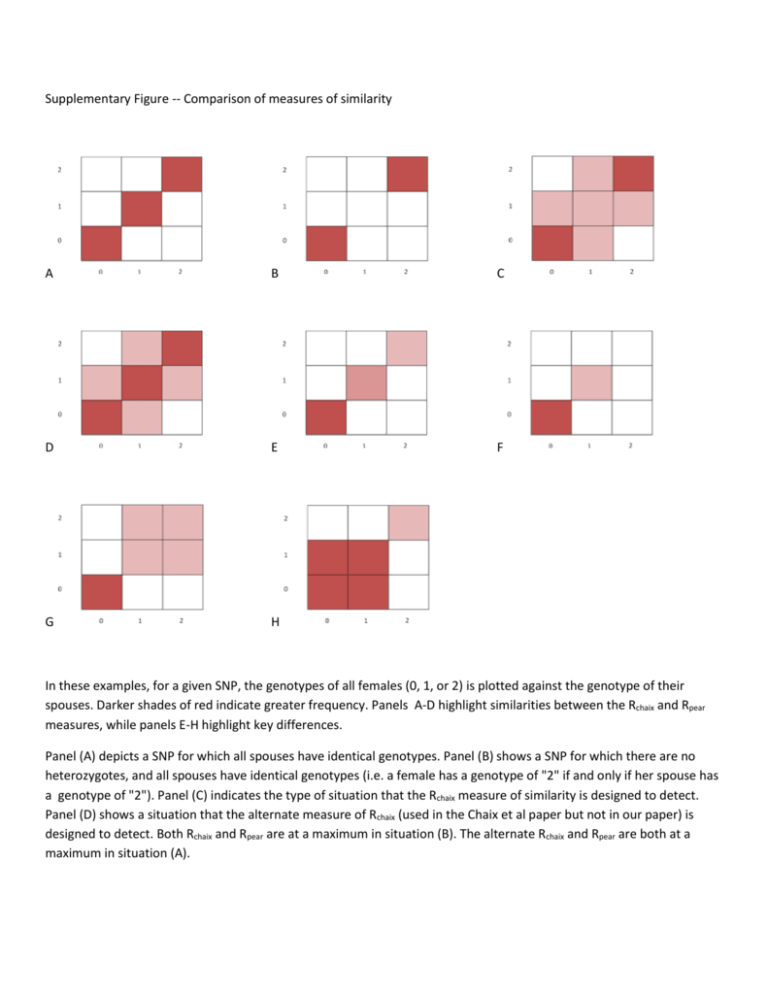
Supplementary Figure -- Comparison of measures of similarity A B C D E F G H In these examples, for a given SNP, the genotypes of all females (0, 1, or 2) is plotted against the genotype of their spouses. Darker shades of red indicate greater frequency. Panels A-D highlight similarities between the Rchaix and Rpear measures, while panels E-H highlight key differences. Panel (A) depicts a SNP for which all spouses have identical genotypes. Panel (B) shows a SNP for which there are no heterozygotes, and all spouses have identical genotypes (i.e. a female has a genotype of "2" if and only if her spouse has a genotype of "2"). Panel (C) indicates the type of situation that the Rchaix measure of similarity is designed to detect. Panel (D) shows a situation that the alternate measure of Rchaix (used in the Chaix et al paper but not in our paper) is designed to detect. Both Rchaix and Rpear are at a maximum in situation (B). The alternate Rchaix and Rpear are both at a maximum in situation (A). Key differences between Rchaix and Rpear are highlighted in the remaining panels (E - H). In the case where the minor allele frequency is relatively low, say 5-15%, but spouses share identical SNPs (panels E and F), Rpear is at a maximum but Rchaix can be rather low. In the case where similarity at a SNP takes on a dominant model (i.e. a female has one or more copies of an allele if and only if her spouse has one or more copies of the allele) (G), Rpear can be quite high while Rchaix remains low. The same occurs when a recessive model is in play (H). Note: The alternate Rchaix, described in [1], is identical to the Rchaix used in this paper except that it assigns greater similarity to the case where both spouses are heterozygous (the difference between panel C and panel D). 1. Chaix R, Cao C, Donnelly P (2008) Is mate choice in humans MHC-dependent? PLoS Genet 4: e1000184.


