Plate Tectonics Question Bank
advertisement
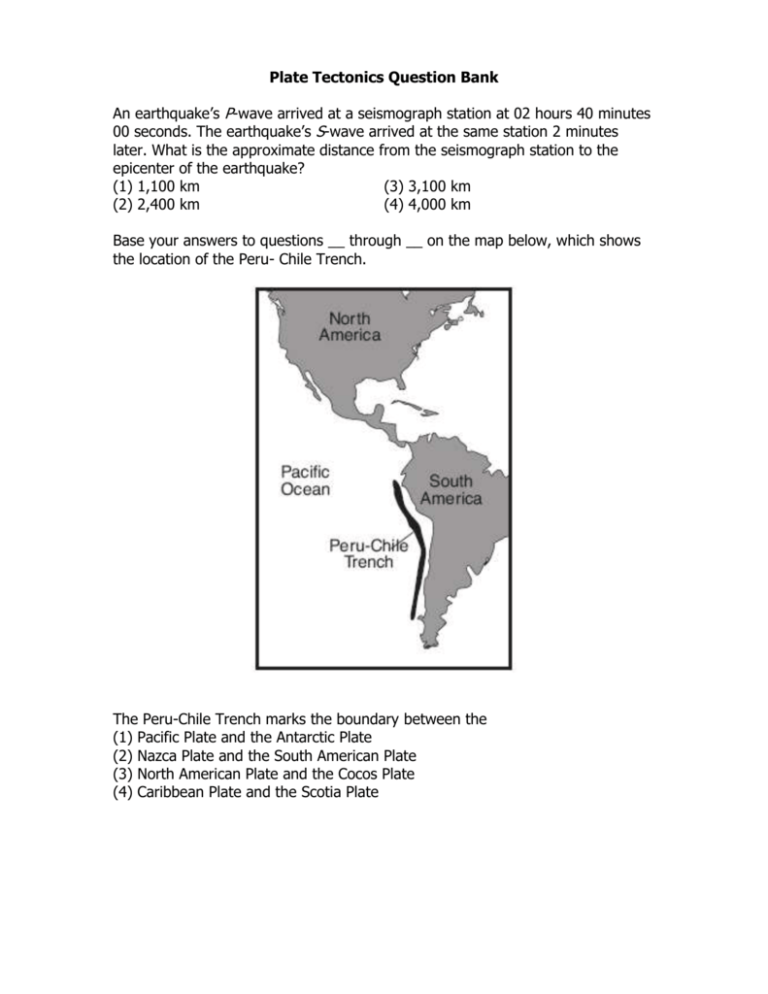
Plate Tectonics Question Bank An earthquake’s P-wave arrived at a seismograph station at 02 hours 40 minutes 00 seconds. The earthquake’s S-wave arrived at the same station 2 minutes later. What is the approximate distance from the seismograph station to the epicenter of the earthquake? (1) 1,100 km (3) 3,100 km (2) 2,400 km (4) 4,000 km Base your answers to questions __ through __ on the map below, which shows the location of the Peru- Chile Trench. The Peru-Chile Trench marks the boundary between the (1) Pacific Plate and the Antarctic Plate (2) Nazca Plate and the South American Plate (3) North American Plate and the Cocos Plate (4) Caribbean Plate and the Scotia Plate In which diagram do the arrows best represent the motions of Earth’s crust at the Peru-Chile Trench? Which observation provides the best evidence of the pattern of crustal movement at the Peru- Chile Trench? (1) the direction of flow of warm ocean currents (2) the mineral composition of samples of mafic mantle rock (3) comparison of the rates of sediment deposition (4) the locations of shallow-focus and deep focus earthquakes Approximately how long does an earthquake P-wave take to travel the first 6500 kilometers after the earthquake occurs? (1) 6.5 min (3) 10.0 min (2) 8.0 min (4) 18.5 min Compared to Earth’s crust, Earth’s core is believed to be (1) less dense, cooler, and composed of more iron (2) less dense, hotter, and composed of less iron (3) more dense, hotter, and composed of more iron (4) more dense, cooler, and composed of less iron The study of how seismic waves change as they travel through Earth has revealed that (1) P-waves travel more slowly than S-waves through Earth’s crust (2) seismic waves travel more slowly through the mantle because it is very dense (3) Earth’s outer core is solid because P-waves are not transmitted through this layer (4) Earth’s outer core is liquid because S-waves are not transmitted through this layer Base your answers to questions __ through __ on the map and data table below. The map shows the locations of volcanic islands and seamounts that erupted on the seafloor of the Pacific Plate as it moved northwest over a stationary mantle hotspot beneath the lithosphere. The hotspot is currently under Kilauea. Island size is not drawn to scale. Locations X, Y, and Z are on Earth’s surface. Approximately how far has location X moved from its original location over the hotspot? (1) 3,600 km (3) 1,800 km (2) 2,500 km (4) 20 km According to the data table, what is the approximate speed at which the island of Kauai has been moving away from the mantle hotspot, in kilometers per million years? (1) 1 (3) 100 (2) 10 (4) 1,000 Which lithospheric plate boundary features are located at Y and Z? (1) trenches created by the subduction of the Pacific Plate (2) rift valleys created by seafloor spreading of the Pacific Plate (3) secondary plates created by volcanic activity within the Pacific Plate (4) mid-ocean ridges created by faulting below the Pacific Plate The Himalayan Mountains are located along a portion of the southern boundary of the Eurasian Plate. At the top of Mt. Everest (29,028 feet) in the Himalayan Mountains, climbers have found fossilized marine shells in the surface bedrock. From this observation, which statement is the best inference about the origin of the Himalayan Mountains? (1) The Himalayan Mountains were formed by volcanic activity. (2) Sea level has been lowered more than 29,000 feet since the shells were fossilized. (3) The bedrock containing the fossil shells is part of an uplifted seafloor. (4) The Himalayan Mountains formed at a divergent plate boundary. Earth’s outer core is best inferred to be (1) liquid, with an average density of approximately 4 g/cm3 (2) liquid, with an average density of approximately 11 g/cm3 (3) solid, with an average density of approximately 4 g/cm3 (4) solid, with an average density of approximately 11 g/cm3 Base your answers to questions __ through __ on the map below. The map shows the locations of deep-sea core drilling sites numbered 1 through 4. The approximate location of the East Pacific Ridge is shown by a dashed line. Point A is located on the East Pacific Ridge. At point A, the East Pacific Ridge is the boundary between the (1) Cocos Plate and the North American Plate (2) South American Plate and the Nazca Plate (3) Pacific Plate and the South American Plate (4) Pacific Plate and the Nazca Plate At which drilling site would the oldest igneous bedrock most likely be found? (1) 1 (3) 3 (2) 2 (4) 4 Compared to the thickness and density of the continental crust of South America, the oceanic crust of the Pacific floor is (1) thinner and less dense (3) thicker and less dense (2) thinner and more dense (4) thicker and more dense Base your answers to questions __ and __ on the map below. Seismic stations are located at the four cities shown on the map. Letter X represents the epicenter of an earthquake determined from seismic waves recorded at all four cities. At which city is there a difference of approximately 3 minutes and 20 seconds between the arrival times of the P-waves and the S-waves? (1) New Orleans (3) Pittsburgh (2) Louisville (4) New York City Which map correctly shows how the location of the epicenter was determined? The block diagram below shows the bedrock age as measured by radioactive dating and the present location of part of the Hawaiian Island chain. These volcanic islands may have formed as the Pacific Plate moved over a mantle hot spot. This diagram provides evidence that the Pacific Crustal Plate was moving toward the (1) south (3) southwest (2) east (4) northwest Base your answers to questions __ and __ on the diagram below, which shows a portion of Earth’s interior. Point A is a location on the interface between layers. The arrows shown in the asthenosphere represent the inferred slow circulation of the plastic mantle by a process called (1) insolation (3) conduction (2) convection (4) radiation The temperature of rock at location A is approximately (1) 600°C (3) 2,600°C (2) 1,000°C (4) 3,000° The diagram below shows the bedrock structure beneath a series of hills. Which process was primarily responsible for forming the hills? (1) folding (3) deposition (2) faulting (4) vulcanism The map below shows the Atlantic Ocean divided into zones A, B, C, and D. The Mid-Atlantic Ridge is located between zones B and C. Which graph best represents the geologic age of the surface bedrock on the ocean bottom? The diagram below shows land features that have been disrupted by an earthquake. Which type of crustal movement most likely caused the displacement of features in this area? (1) vertical lifting of surface rock (3) down-warping of the crust (2) folding of surface rock (4) movement along a transform fault The diagram below is a seismogram of the famous San Francisco earthquake of 1906, recorded at a seismic station located 6,400 kilometers from San Francisco. Which time scale best represents the arrival-time difference between P-waves and S-waves at this station? Base your answers to questions __ and __ in part on the news article and map below. Points A and B on the map are reference points. Huge Quake Possible in Oregon Valley Scientists have warned for years that a magnitude 8 or 9 earthquake could strike about 30 miles off the Oregon coast, causing huge tsunamis (large ocean waves) and tremendous damage. Now scientists say these earthquakes could be centered much farther inland and cause severe damage to a larger area, including cities in Oregon such as Portland, Salem, and Eugene. Geologic evidence suggests that strong quakes in this area occur about every 400 years, plus or minus 200 years. The last one, believed to be a magnitude 9, occurred 300 years ago. A magnitude 8 quake can cause tremendous damage. The San Francisco quake of 1906 has been estimated at 7.9. The Mexico City quake of 1985 that left thousands dead was measured at 8.1. (Continued on next page) The cross section in your answer booklet shows the lithosphere and asthenosphere between points A and B on the map. a On the cross section provided in your answer booklet, draw an arrow in the Juan de Fuca Plate to indicate the direction of the relative movement of the plate. [1] b Identify the type of tectonic plate boundary that exists at the Juan de Fuca Ridge. [1] c Identify the name of the plate in the cross section labeled x. [1] d How does the average earthquake depth beneath the Oregon coastline compare to the average earthquake depth beneath Mt. Hood? [1] An emergency management specialist in Portland, Oregon, is developing a plan that would help save lives or prevent property damage in the event of a future earthquake. Describe two actions or ideas that should be included in the plan. [2] a b _____________________________________ plate boundary c _____________________________________ Plate d ______________________________________________________________ ______________________________________________________________ # (1) _____________________________________________________________ _________________________________________________________________ (2) _____________________________________________________________ _________________________________________________________________ Base your answers to questions __ and __ on the map below of Iceland, a country located on the Mid-Atlantic Ridge. Four locations are represented by the letters A through D. The fine-grained texture of most of the igneous rock formed on the surface of Iceland is due to (1) rapid cooling of the molten rock (3) numerous faults in the island’s bedrock (2) high density of the molten rock (4) high pressure under the island The youngest bedrock is most likely found at which location? (1)A (3) C (2) B (4) D Base your answers to questions __ through __ on the diagram and map below. The diagram shows three seismograms of the same earthquake recorded at three different seismic stations, X, Y, and Z. The distances from each seismic station to the earthquake epicenter have been drawn on the map. A coordinate system has been placed on the map to describe locations. The map scale has not been included. Approximately how far away from station Y is the epicenter? (1) 1,300 km (3) 3,900 km (2) 2,600 km (4) 5,200 km The S-waves from this earthquake that travel toward Earth’s center will (1) be deflected by Earth’s magnetic field (2) be totally reflected off the crust-mantle interface (3) be absorbed by the liquid outer core (4) reach the other side of Earth faster than those that travel around Earth in the crust Seismic station Z is 1,700 kilometers from the epicenter. Approximately how long did it take the P-wave to travel to station Z? (1) 1 min 50 sec (3) 3 min 30 sec (2) 2 min 50 sec (4) 6 min 30 sec On the map, which location is closest to the epicenter of the earthquake? (1) E–5 (3) H–3 (2) G–1 (4) H–8 Base your answers to questions 25 and 26 on the earthquake seismogram below. When did the first P-waves arrive at this seismic station? (1) 3 minutes after an earthquake occurred 2,600 km away (2) 5 minutes after an earthquake occurred 2,600 km away (3) 9 minutes after an earthquake occurred 3,500 km away (4) 11 minutes after an earthquake occurred 3,500 km away How many additional seismic stations must report seismogram information in order to locate this earthquake? (1) one (3) three (2) two (4) four Base your answers to questions __ through __ on the diagram below. The diagram shows a model of the relationship between Earth’s surface and its interior. Mid-ocean ridges (rifts) normally form where tectonic plates are (1) converging (3) stationary (2) diverging (4) sliding past each other The motion of the convection currents in the mantle beneath the Atlantic Ocean appears to be mainly making this ocean basin (1) deeper (3) wider (2) shallower (4) narrower According to the diagram, the deep trench along the west coast of South America is caused by movement of the oceanic crust that is (1) sinking beneath the continental crust (2) uplifting over the continental crust (3) sinking at the Mid-Atlantic ridge (4) colliding with the Atlantic oceanic crust The diagram below shows some features of Earth’s crust and upper mantle. Which model most accurately shows the movements (arrows) associated with the surface features shown in the diagram? Base your answers to questions __ through __ on the map below. The map shows the continents of Africa and South America, the ocean between them, and the ocean ridge and transform faults. Locations A and D are on the continents. Locations B and C are on the ocean floor. The hottest crustal temperature measurements would most likely be found at location (1) A (3) C (2) B (4) D Which table best shows the relative densities of the crustal bedrock at locations A, B, C, and D? Which graph best shows the relative age of the ocean-floor bedrock from location B to location C? Base your answers to questions __ through __ on the data table below, which gives information collected at seismic stations A, B, C, and D for the same earthquake. Some of the data has been deliberately omitted. What is the most probable reason for the absence of S-waves at station A? (1) S-waves cannot travel through liquids. (2) S-waves were not generated at the epicenter. (3) Station A was located on solid bedrock. (4) Station A was located too close to the epicenter. What is the approximate distance from station C to the earthquake epicenter? (1) 3,200 km (3) 1,600 km (2) 2,400 km (4) 1,000 km How long did it take the P-wave to travel from the epicenter of the earthquake to seismic station D? (1) 00:46:20 (3) 00:17:20 (2) 00:39:20 (4) 00:09:40 Base your answers to questions 44 through 46 on the map below, which shows the location of mid-ocean ridges and the age of some oceanic bedrock near these ridges. Letters A through D are locations on the surface of the ocean floor. What is the most probable age, in millions of years, of the bedrock at location B? (1) 5 (3) 48 (2) 12 (4) 62 Rising convection currents in the asthenosphere would most likely be under location (1) A (3) C (2) B (4) D The age of oceanic bedrock on either side of a mid-ocean ridge is supporting evidence that at the ridges, tectonic plates are (1) diverging (3) locked in place (2) converging (4) being subducted Base your answers to questions __ through __ on the passage and map below and on your knowledge of Earth science. The passage provides some information about the sediments under Portland, Oregon, and the map shows where Portland is located. Bad seismic combination under Portland: Earthquake faults and jiggly sediment Using a technique called seismic profiling, researchers have found evidence of ancient earthquake faults under Portland, Oregon. The faults may still be active, a USGS [United States Geological Survey] seismologist will announce tomorrow. The research also turned up a 250-foot deep layer of silt and mud, deep under the city, which may have been caused by a catastrophic ice dam break some 15,000 years ago. The two findings could together mean bad news, as soft sediment is known to amplify ground shaking during strong earthquakes. In the 1989 San Francisco earthquake, much of the damage to buildings was caused by liquefaction, a shaking and sinking of sandy, water saturated soil along waterways. . . . — Robert Roy Britt excerpted from “Bad sesimic combination under Portland: Earthquake faults and jiggly sediment” explorezone.com 05/03/99 Explain why Portland is likely to experience a major earthquake. [1] Why is the presence of a layer of silt and mud deep under the city a danger to Portland? [1] Describe one precaution that can be taken to prevent or reduce property damage in preparation for a future earthquake in Portland. [1] What type of tectonic plate boundary is shown at the San Andreas Fault? [1] (June 01 – June 03)
