The electrons, which are contaminating the muon sample
advertisement
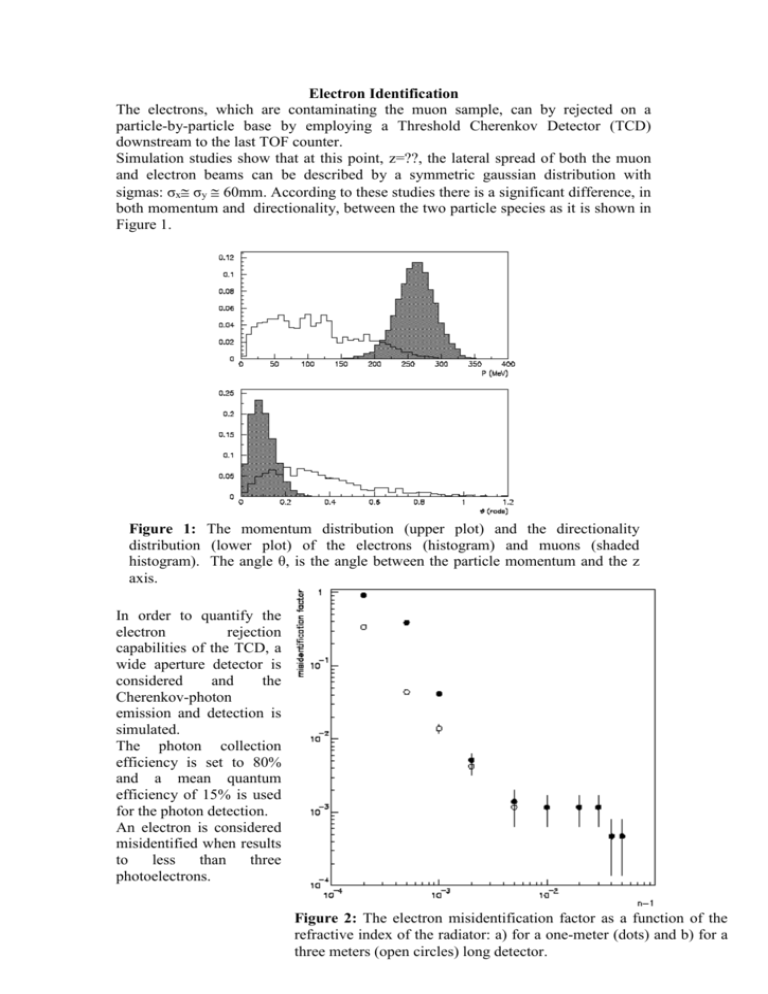
Electron Identification The electrons, which are contaminating the muon sample, can by rejected on a particle-by-particle base by employing a Threshold Cherenkov Detector (TCD) downstream to the last TOF counter. Simulation studies show that at this point, z=??, the lateral spread of both the muon and electron beams can be described by a symmetric gaussian distribution with sigmas: σx σy 60mm. According to these studies there is a significant difference, in both momentum and directionality, between the two particle species as it is shown in Figure 1. Figure 1: The momentum distribution (upper plot) and the directionality distribution (lower plot) of the electrons (histogram) and muons (shaded histogram). The angle θ, is the angle between the particle momentum and the z axis. In order to quantify the electron rejection capabilities of the TCD, a wide aperture detector is considered and the Cherenkov-photon emission and detection is simulated. The photon collection efficiency is set to 80% and a mean quantum efficiency of 15% is used for the photon detection. An electron is considered misidentified when results to less than three photoelectrons. Figure 2: The electron misidentification factor as a function of the refractive index of the radiator: a) for a one-meter (dots) and b) for a three meters (open circles) long detector. The fraction of misidentified electrons is estimated for several refractive indices, well below to the muon Cherenkov threshold. These results are shown in Figure 2, for two different detector lengths . A radiator with a refractive index of 1.0051 offers a rejection factor of the order of 1000. The remaining, low momentum, electrons start radiating at much higher refractive indices as it is shown in Figure 2. However a further rejection can be achieved by applying extra kinematical cuts. The lateral dimensions of this detector will be precisely defined when more accurate simulations will be available. 1 This, as an example, corresponds to Nitrogen at 17 bars.

