Supplementary Figures 1–7 (doc 1202K)
advertisement
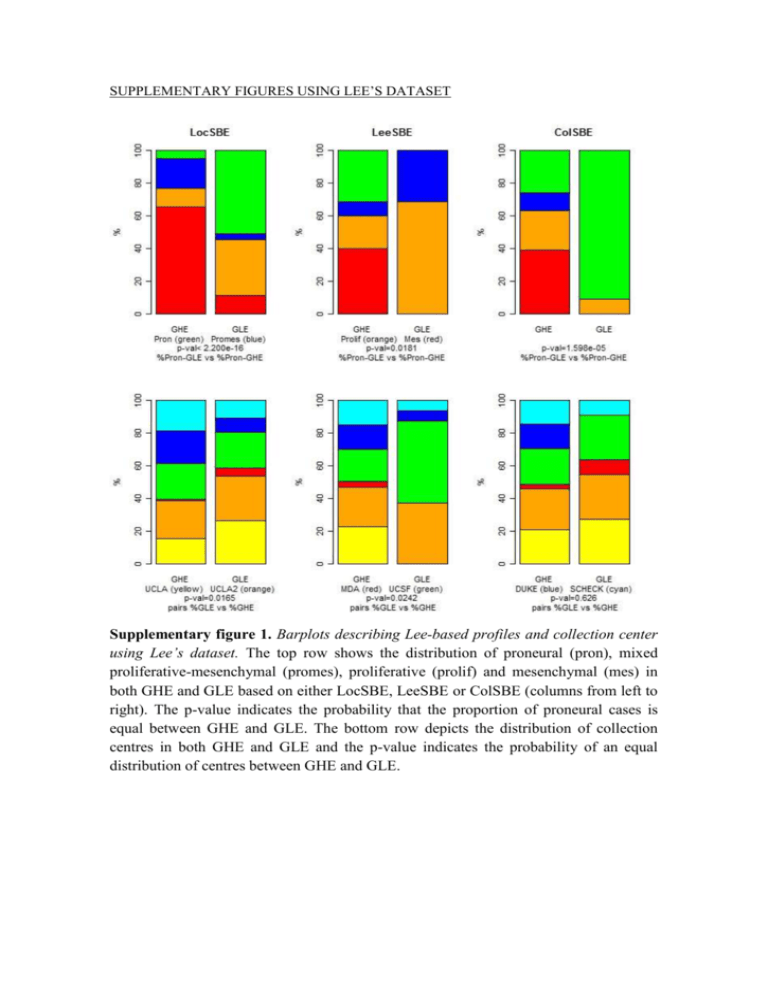
SUPPLEMENTARY FIGURES USING LEE’S DATASET Supplementary figure 1. Barplots describing Lee-based profiles and collection center using Lee’s dataset. The top row shows the distribution of proneural (pron), mixed proliferative-mesenchymal (promes), proliferative (prolif) and mesenchymal (mes) in both GHE and GLE based on either LocSBE, LeeSBE or ColSBE (columns from left to right). The p-value indicates the probability that the proportion of proneural cases is equal between GHE and GLE. The bottom row depicts the distribution of collection centres in both GHE and GLE and the p-value indicates the probability of an equal distribution of centres between GHE and GLE. Supplementary figure 2. Barplots describing genetic alterations using Lee’s dataset. The top row shows the percentage of cases with MGMT over or non-overexpressed in both GHE and GLE using either LocSBE, LeeSBE or ColSBE (columns from left to right). The middle and bottom rows display the same, but for genes the percentage of cases with VEGF and EGFR, respectively. The p-value indicates the probability that the percentage of cases with non-overexpression is equal between GHE and GLE. Supplementary figure 3. Barplots describing therapy administered using Lee’s dataset. The top row shows the percentage of cases receiving chemotherapy, the middle one radiotherapy and the bottom one complementary temodar administration. GHE and GLE were classified using either LocSBE, LeeSBE or ColSBE (columns from left to right). The p-value indicates the probability that the percentage of cases receiving each type of therapy is equal between GHE and GLE. Supplementary figure 4. Barplots describing age and gender using Lee’s dataset. The top row shows the percentage of females (orange) and males (blue) in GHE and GLE based on either LocSBE, LeeSBE or ColSBE (columns from left to right). The p-value indicates the probability that the percentage of females is equal in GHE and GLE. The bottom row provides the averaged age of GHE and GLE. The p-value indicates the probability that the averaged age in GHE and GLE is equal. SUPPLEMENTARY FIGURES USING GRAVENDEEL’S DATASET Supplementary figure 5. Barplots describing genetic alterations using Gravendeel’s dataset. From top to bottom rows is depicted loss of heterozygosis (LOH) of chromosome 1p and 19q, IDH1 mutation and EGFR amplification in GHE and GLE based on either LocSBE, LeeSBE or ColSBE (columns from left to right). For the two top rows, the p-value indicates the probability that the percentage of cases showing LOH is equal between GHE and GLE, whereas for the two bottom ones, it denotes the probability that the percentage of wild type (WT) cases is equal between GHE and GLE. Supplementary figure 6. Barplots describing therapy interventions using Gravendeel’s dataset. Top row depicts the type of surgical intervention used to remove the biopsy for each patient. The percentage of each type is plotted for GHE and GLE based on either LocSBE, LeeSBE or ColSBE (columns from left to right). Compl. res., Open biop., Part. res. and Ster. biop., mean complete resection, open biopsy, partial resection and stereotactic biopsy, respectively. The p-value indicates the probability that the percentage of cases with a complete resection is equal between GHE and GLE. The middle row depicts the percentage of cases who were subjected to radiotherapy in GHE and GLE. The p-value indicates that the percentage of cases subjected to radiotherapy in GHE and GLE is equal. The bottom row provides the percentage of patients either subjected or not subjected to chemotherapy in GHE and GLE. The p-value indicates the probability that the percentage of cases subjected to chemotherapy is equal. Supplementary figure 7. Barplots describing age, gender and KPS using Gravendeel’s dataset. The top row shows the percentage of females (orange) and males (blue) in GHE and GLE based on either LocSBE, LeeSBE or ColSBE (columns from left to right). The p-value indicates the probability that the percentage of females is equal in GHE and GLE. The middle row provides the averaged age of GHE and GLE. The p-value indicates the probability that the averaged age in GHE and GLE is equal. The bottom row provides the averaged Karnofsky performance status (KPS) of GHE and GLE. The p-value indicates the probability that the averaged KPS in GHE and GLE is equal.

