Additional file 5
advertisement
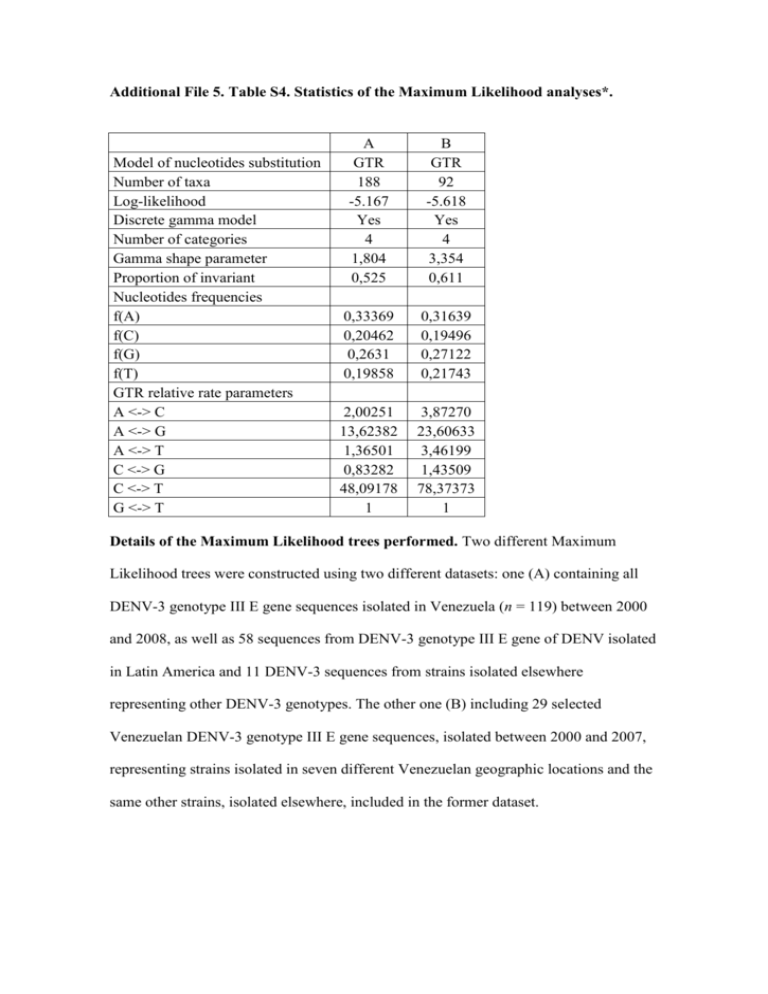
Additional File 5. Table S4. Statistics of the Maximum Likelihood analyses*. Model of nucleotides substitution Number of taxa Log-likelihood Discrete gamma model Number of categories Gamma shape parameter Proportion of invariant Nucleotides frequencies f(A) f(C) f(G) f(T) GTR relative rate parameters A <-> C A <-> G A <-> T C <-> G C <-> T G <-> T A GTR 188 -5.167 Yes 4 1,804 0,525 B GTR 92 -5.618 Yes 4 3,354 0,611 0,33369 0,20462 0,2631 0,19858 0,31639 0,19496 0,27122 0,21743 2,00251 13,62382 1,36501 0,83282 48,09178 1 3,87270 23,60633 3,46199 1,43509 78,37373 1 Details of the Maximum Likelihood trees performed. Two different Maximum Likelihood trees were constructed using two different datasets: one (A) containing all DENV-3 genotype III E gene sequences isolated in Venezuela (n = 119) between 2000 and 2008, as well as 58 sequences from DENV-3 genotype III E gene of DENV isolated in Latin America and 11 DENV-3 sequences from strains isolated elsewhere representing other DENV-3 genotypes. The other one (B) including 29 selected Venezuelan DENV-3 genotype III E gene sequences, isolated between 2000 and 2007, representing strains isolated in seven different Venezuelan geographic locations and the same other strains, isolated elsewhere, included in the former dataset.
