Enyme Catalysis Lab: AP Lab # 2
advertisement
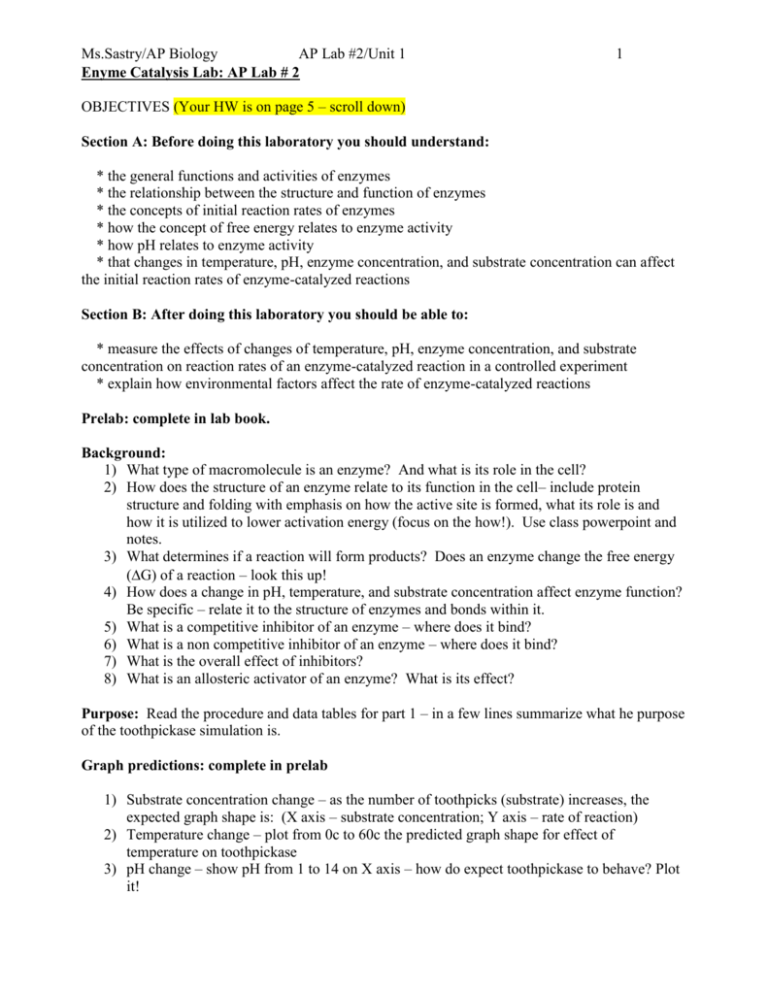
Ms.Sastry/AP Biology AP Lab #2/Unit 1 Enyme Catalysis Lab: AP Lab # 2 1 OBJECTIVES (Your HW is on page 5 – scroll down) Section A: Before doing this laboratory you should understand: * the general functions and activities of enzymes * the relationship between the structure and function of enzymes * the concepts of initial reaction rates of enzymes * how the concept of free energy relates to enzyme activity * how pH relates to enzyme activity * that changes in temperature, pH, enzyme concentration, and substrate concentration can affect the initial reaction rates of enzyme-catalyzed reactions Section B: After doing this laboratory you should be able to: * measure the effects of changes of temperature, pH, enzyme concentration, and substrate concentration on reaction rates of an enzyme-catalyzed reaction in a controlled experiment * explain how environmental factors affect the rate of enzyme-catalyzed reactions Prelab: complete in lab book. Background: 1) What type of macromolecule is an enzyme? And what is its role in the cell? 2) How does the structure of an enzyme relate to its function in the cell– include protein structure and folding with emphasis on how the active site is formed, what its role is and how it is utilized to lower activation energy (focus on the how!). Use class powerpoint and notes. 3) What determines if a reaction will form products? Does an enzyme change the free energy (G) of a reaction – look this up! 4) How does a change in pH, temperature, and substrate concentration affect enzyme function? Be specific – relate it to the structure of enzymes and bonds within it. 5) What is a competitive inhibitor of an enzyme – where does it bind? 6) What is a non competitive inhibitor of an enzyme – where does it bind? 7) What is the overall effect of inhibitors? 8) What is an allosteric activator of an enzyme? What is its effect? Purpose: Read the procedure and data tables for part 1 – in a few lines summarize what he purpose of the toothpickase simulation is. Graph predictions: complete in prelab 1) Substrate concentration change – as the number of toothpicks (substrate) increases, the expected graph shape is: (X axis – substrate concentration; Y axis – rate of reaction) 2) Temperature change – plot from 0c to 60c the predicted graph shape for effect of temperature on toothpickase 3) pH change – show pH from 1 to 14 on X axis – how do expect toothpickase to behave? Plot it! Ms.Sastry/AP Biology AP Lab #2/Unit 1 2 4) Inhibitor effect - now in graph 1) plot how the graph will shift in shape if an inhibitor is added to the toothpickase 5) Activator effect – do the same as in 3) except for an activator Bring from home an inhibitor or activator you can use in this lab! Print out Tables 1,2, and 3 and paste in lab book. Continue reading next page…. Ms.Sastry/AP Biology AP Lab #2/Unit 1 3 PART 1: ‘Toothpickase’ - Simulation of Enzyme Activity Materials: 30 toothpicks per run of the simulation; clock/watch with a second hand In this activity, the toothpicks represent and you represent the , toothpick-ase. When you break a toothpick, the place where the toothpick fits between your fingers represents the . As you heard in the class lecture, there are several factors that affects the rate of an enzyme catalyzed reaction. These factors are listed on the first column of this table. Complete this table: TABLE 1 – Planning and reasoning Factor Effect on Enzyme Catalyzed reaction Biochemical Reason For This Effect Substrate concentration As [S] increases, reaction rate will ? More chance of enzyme encountering eubstrate until all active sites are ? Until ? Temperature pH Competitive Inhibitor Noncompetiti ve Inhibitor Allosteric Activator How can this be simulated in the toothpickase activity? Increase the number of toothpicks Expected Graph Ms.Sastry/AP Biology Procedure: AP Lab #2/Unit 1 4 1. Count out 30 toothpicks on your desk. 2. Break as many toothpicks as you can in 10 seconds and record this on the data table. Broken toothpicks should be thrown into the pile of unbroken toothpicks because products & reactants mix in metabolic reactions. DO NOT BREAK TOOTHPICKS ALREADY BROKEN! 3. Count out another stack of 30 toothpicks. Do 30 seconds of breaking and count and record the number of toothpicks broken. 4. Count out another stack of 30 toothpicks. Do 60 seconds of breaking and count and record the number of toothpicks broken. 5. Continue breaking toothpicks for these time intervals (120, 180 seconds). 6. Graph the number of toothpicks broken as a function of time (0, 10, 30, 60, 120, 180 seconds). Be sure to title your graph and to label the x and y-axis. 7. Choose one factor that can affect your toothpickase enzyme function and repeat the simulation under these altered conditions. Run 2) Factor Chosen: How the simulation will be done: 8. Graph this second run on the same paper as the previous one. Table #2: give a title: Setup Time Number of (X) toothpicks (seconds) broken (Y) Predict Actual 1 0 2 10 3 30 4 60 5 120 6 180 0 0 Rate of the Reaction Yn+1-Yn ---------Xn+1-Xn Number of toothpicks broken in the second run with a “factor” Predict Actual 0 0 Rate of the Reaction (2nd run) Ms.Sastry/AP Biology AP Lab #2/Unit 1 5 Record the class data on the next page: record the class average for first run and the times for each of the simulations. Compare class average with the different simulations. Class data table #3: (give a title) Time (sec) 10 30 60 120 180 Vmax [Substrate] pH Class Average temp Competitive Noncompetitive Allosteric Inhibitor Inhibitor Activator 6.6 4.3 4.3 2.5 5.0 21.6 14.3 13.0 11.5 13.5 29.8 26.3 17.0 22.0 19.2 30 30.0 30.0 30.0 27.3 30 30.0 30.0 30.0 29.0 Not done Figure this out HW: Your graphs and data tables: a) You need 2 graphs – one for your own data in table 2 and one for class data in table 3 above. X axis – time; Y axis – disappearance of reactant/formation of product b) Calculate the rates for all the class data factors. Just as you did it for your own data and construct a new data table and place the rates in it. c) Vmax = maximum velocity the enzyme is able to achieve – what do you believe this is? Look up this concept on the internet and see if you can figure out what Vmax was toothpickase? Data Analysis (will go in conclusion/discussion of lab report later): 1) Looking at your own data and graph – what general conclusions can you come up with? 2) Do the same for class dataand graph for the control group. 3) Now analyze your factor data/graph as well as class factors data/graph. (Important - Think about this before writing this section – how can this section be data analysis rather than repeating the results in words? )

