crokesupplemental
advertisement
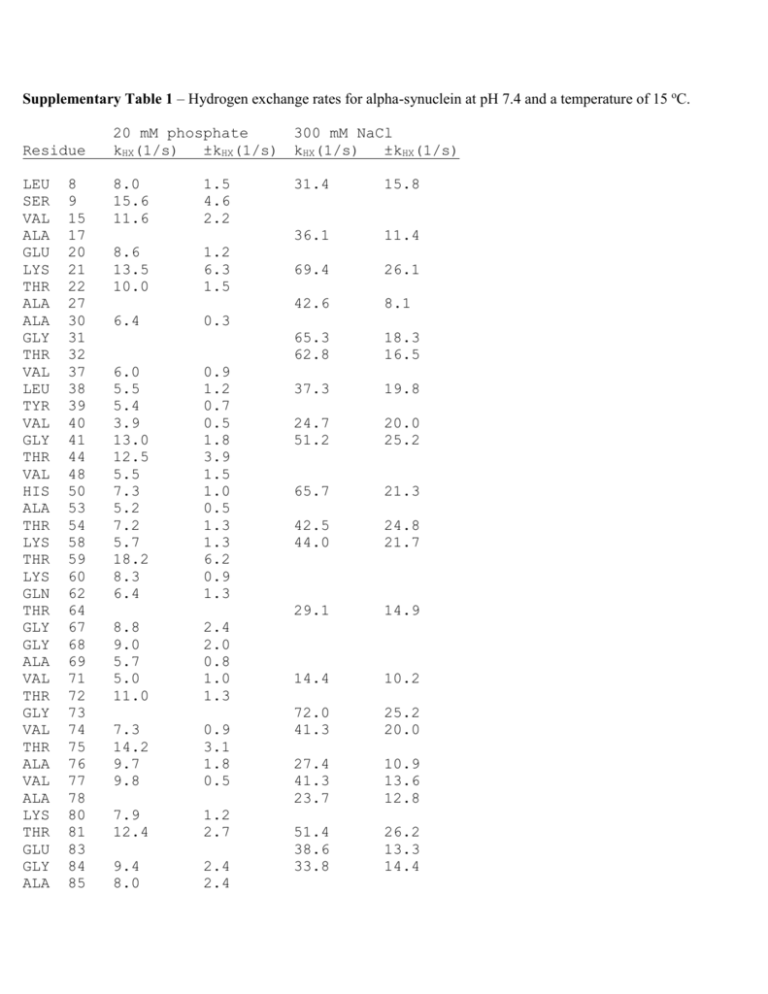
Supplementary Table 1 – Hydrogen exchange rates for alpha-synuclein at pH 7.4 and a temperature of 15 oC. Residue LEU SER VAL ALA GLU LYS THR ALA ALA GLY THR VAL LEU TYR VAL GLY THR VAL HIS ALA THR LYS THR LYS GLN THR GLY GLY ALA VAL THR GLY VAL THR ALA VAL ALA LYS THR GLU GLY ALA 8 9 15 17 20 21 22 27 30 31 32 37 38 39 40 41 44 48 50 53 54 58 59 60 62 64 67 68 69 71 72 73 74 75 76 77 78 80 81 83 84 85 20 mM phosphate kHX(1/s) ±kHX(1/s) 300 mM NaCl kHX(1/s) ±kHX(1/s) 8.0 15.6 11.6 31.4 15.8 36.1 11.4 69.4 26.1 42.6 8.1 65.3 62.8 18.3 16.5 37.3 19.8 24.7 51.2 20.0 25.2 65.7 21.3 42.5 44.0 24.8 21.7 29.1 14.9 14.4 10.2 72.0 41.3 25.2 20.0 27.4 41.3 23.7 10.9 13.6 12.8 51.4 38.6 33.8 26.2 13.3 14.4 1.5 4.6 2.2 8.6 13.5 10.0 1.2 6.3 1.5 6.4 0.3 6.0 5.5 5.4 3.9 13.0 12.5 5.5 7.3 5.2 7.2 5.7 18.2 8.3 6.4 0.9 1.2 0.7 0.5 1.8 3.9 1.5 1.0 0.5 1.3 1.3 6.2 0.9 1.3 8.8 9.0 5.7 5.0 11.0 2.4 2.0 0.8 1.0 1.3 7.3 14.2 9.7 9.8 0.9 3.1 1.8 0.5 7.9 12.4 1.2 2.7 9.4 8.0 2.4 2.4 GLY SER ALA ALA THR GLY PHE VAL LYS ASP ASN GLU ALA GLN GLU LEU ASP ASP GLU ALA MET SER GLU GLU GLY ASP TYR GLU ALA 86 87 89 90 92 93 94 95 96 98 103 104 107 109 110 113 119 121 123 124 127 129 130 131 132 135 136 139 140 7.3 9.6 5.1 5.5 7.9 13.0 2.5 0.5 0.5 0.8 2.4 4.0 5.9 5.1 8.1 9.2 2.9 3.0 5.2 3.0 3.6 2.1 4.0 3.3 3.0 3.3 4.1 4.6 5.2 5.3 3.4 2.7 4.4 3.0 0.5 0.3 2.3 3.9 0.3 0.9 0.7 0.8 0.5 0.7 0.8 0.8 0.5 0.6 0.4 0.2 0.6 0.6 0.3 0.8 0.9 0.7 36.9 23.0 44.4 69.9 51.2 33.1 20.1 31.7 28.4 14.3 23.9 8.1 74.6 29.6 64.4 41.3 24.5 9.0 12.7 14.5 23.4 5.1 53.0 8.8 45.2 45.1 21.5 23.0 24.7 4.8 40.7 27.2 Supplementary Fig. S1 Figure S1. NMR assignments for 0.25 mM S in 20 mM sodium phosphate, pH 7.4, and a temperature of 10 oC. Supplementary Fig. S2 Figure S2. NMR spectra of S without (A-C) or with (D-F) 3.5 mM GM1 micelles. 1H-15N HSQC (A, D), H-C selective ct-1H-13C HSQC (B, E), and aromatic-selective ct-1H-13C HSQC (C, F). All spectra were recorded at 10 oC. Positive and negative phases are indicated by black and red contours. Supplementary Fig. S3 Figure S3. CLEANEX spectroscopy of S. (A) Control Fast-HSQC spectrum. (B) CLEANEX spectrum with a 16 ms mixing time. The two spectra are plotted so that residues from the acidic C-terminal domain (A107, N113, D119, A124) have roughly the same number of contours. Plotted this way, the correlations from the first 100 amino acids are enhanced relative to those from the last 40 amino acids in the CLEANEX spectrum (B) indicating faster hydrogen exchange for the N-terminal domain. Residue V71, A85 and A89 which are slow exchangers from the N-terminal domain are exceptions, and can be seen at low contour levels in 1H-15N HSQC spectra of S recorded at pH 7.4 and 35 o C, 20 mM sodium phosphate (see Fig. 1D of the main text for the V71 correlation). Supplementary Fig. S4 Figure S4. Representative CLEANEX curves showing the rise in normalized peak intensity due to exchange (20 mM phosphate sample), as the mixing time that allows magnetization transfer from solvent to sites on the protein is increased. The initial slopes of these curves are dependent on the rates of hydrogen exchange at particular sites, and are typically larger for the N-terminal residues (red) than the C-terminal residues (blue). Supplementary Fig. S5 Figure S5. Conformational exchange contributions to 15N R2 values (R2ex) at (A) 10 oC and (B) 35 oC. The 250 µM S sample was in 20 mM phosphate buffer at pH 5.9 in order to minimize exchange of the amide protons at the higher temperature. R2ex values were calculated from the difference in apparent R2s collected with delays (delays between sequential 180o 15N pulses in the CPMG train) of 0.625 ms and 20 ms. The CPMG mixing time was 80 ms. The mean R2ex values were 0.1 Hz at 10 oC and -0.3 Hz at 35 oC indicating the absence of significant exchange contributions at either temperature. Average errors were 0.6 and 1.3 Hz at 10 oC and 35 oC, respectively. The larger errors at 35 oC are probably due to residual hydrogen exchange, which attenuates signal intensities but does not interfere with R2 measurements.
