In Class Exercise 4
advertisement
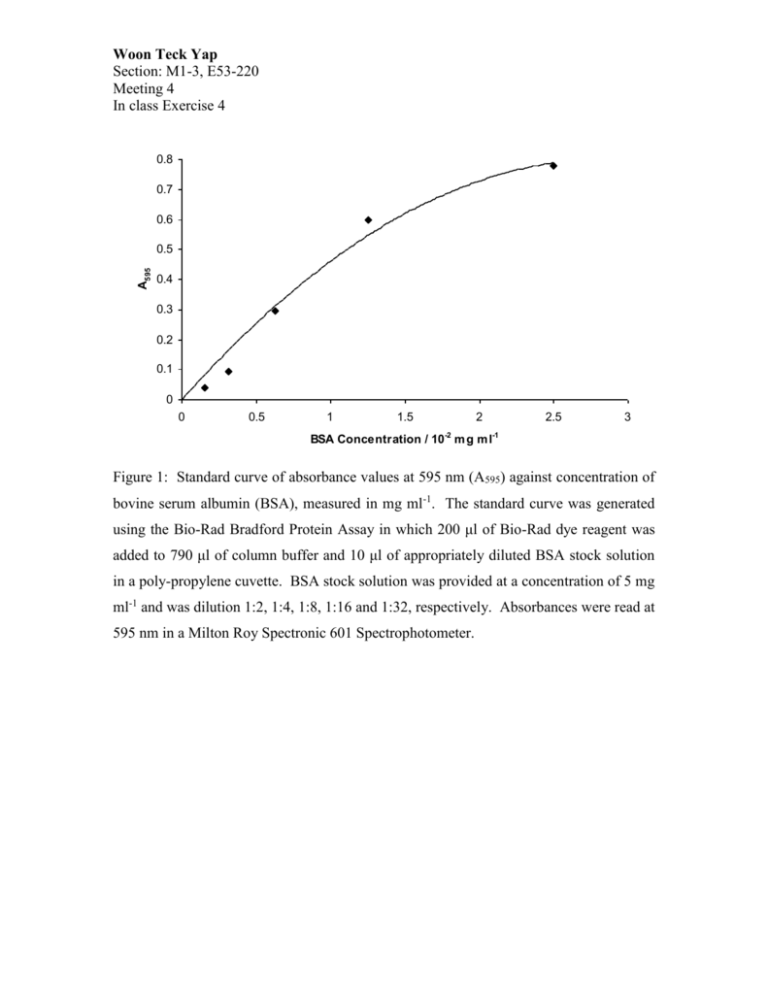
Woon Teck Yap Section: M1-3, E53-220 Meeting 4 In class Exercise 4 0.8 0.7 0.6 A595 0.5 0.4 0.3 0.2 0.1 0 0 0.5 1 1.5 2 2.5 3 BSA Concentration / 10-2 m g m l-1 Figure 1: Standard curve of absorbance values at 595 nm (A595) against concentration of bovine serum albumin (BSA), measured in mg ml-1. The standard curve was generated using the Bio-Rad Bradford Protein Assay in which 200 μl of Bio-Rad dye reagent was added to 790 μl of column buffer and 10 μl of appropriately diluted BSA stock solution in a poly-propylene cuvette. BSA stock solution was provided at a concentration of 5 mg ml-1 and was dilution 1:2, 1:4, 1:8, 1:16 and 1:32, respectively. Absorbances were read at 595 nm in a Milton Roy Spectronic 601 Spectrophotometer. Woon Teck Yap Section: M1-3, E53-220 Meeting 4 In class Exercise 4 Table 1: Table showing various characteristics of protein samples obtained at various steps along the purification pathway. Protein samples analyzed were the crude lysate (CL), crude lysate supernatant (CL-S), ammonium sulphate precipitation supernantant (AS-S), ammonium sulphate precipitation pellet (AS-P), DEAE column loading sample (DEAE-Load), DEAE column eluent (DEAE-Total) and the desalted APTG column eluent (AF/PD-10). The total protein content and total protein activity of each sample were analyzed and used to calculate the specific activity, yield and fold purification of the sample. All figures are reported to 3 significant figures. Sample CL CL-S AS-S AS-P DEAELoad DEAETotal AF/ PD-10 Total Protein/mg 10.4 8.70 8.60 3.75 Total Activity/U 29300 28600 725 4660 Specific Activity/U mg-1 2820 3290 84.3 1240 100 97.6 2.47 15.9 Fold Purification 1.00x 1.16x 0.299x 0.441x 3.68 9030 2450 30.8 0.871x 0.225 470 2090 1.60 0.741x 0.200 306 1530 1.04 0.543x Yield/%
