Acid/Base Worksheet #1
advertisement
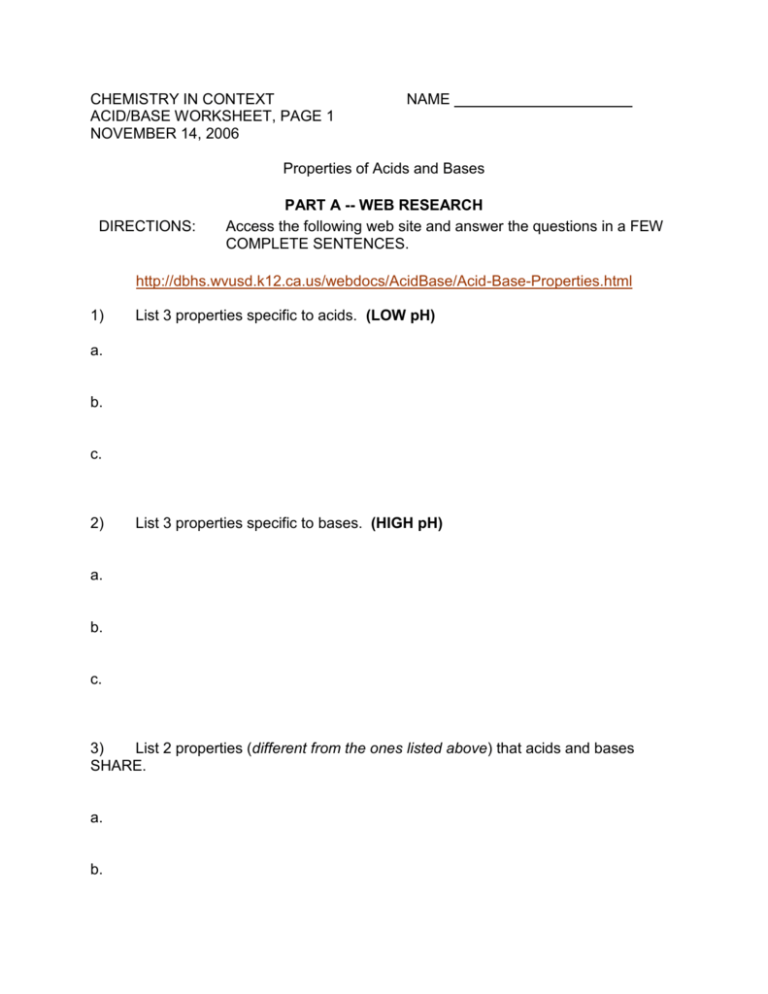
CHEMISTRY IN CONTEXT ACID/BASE WORKSHEET, PAGE 1 NOVEMBER 14, 2006 NAME Properties of Acids and Bases DIRECTIONS: PART A -- WEB RESEARCH Access the following web site and answer the questions in a FEW COMPLETE SENTENCES. http://dbhs.wvusd.k12.ca.us/webdocs/AcidBase/Acid-Base-Properties.html 1) List 3 properties specific to acids. (LOW pH) a. b. c. 2) List 3 properties specific to bases. (HIGH pH) a. b. c. 3) List 2 properties (different from the ones listed above) that acids and bases SHARE. a. b. CHEMISTRY IN CONTEXT ACID/BASE WORKSHEET, PAGE 2 NOVEMBER 14, 2006 DIRECTIONS: NAME PART B -- WEB APPLICATIONS On a the scale of 1-14, the relative pH of an acid is 0-6. The relative pH of a base is 8-14. Access the following web sites and identify the RELATIVE pH range for each picture. Use the table below to help. Acid Household Source Base Household Source citric acid oranges, grapefruits sodium hydroxide (caustic soda) oven cleaner tartaric acid grapes magnesium hydroxide milk of magnesia ascorbic acid Vitamin C sodium hypochlorite bleach acetic acid vinegar methanoic acid stingers of some ants butanoic acid rancid butter oxalic acid tomatoes stearic acid animal fat 1) http://tlsweb.150m.com/8thgrade/Classwork/AcidBasePics/Item1.jpg SUBSTANCE RELATIVE PH RANGE 2) http://tlsweb.150m.com/8thgrade/Classwork/AcidBasePics/Item2.jpg SUBSTANCE RELATIVE PH RANGE 3) http://tlsweb.150m.com/8thgrade/Classwork/AcidBasePics/Item3.jpg SUBSTANCE RELATIVE PH RANGE 4) http://tlsweb.150m.com/8thgrade/Classwork/AcidBasePics/Item4.jpg SUBSTANCE RELATIVE PH RANGE 5) http://tlsweb.150m.com/8thgrade/Classwork/AcidBasePics/Item5.jpg SUBSTANCE RELATIVE PH RANGE 6) http://tlsweb.150m.com/8thgrade/Classwork/AcidBasePics/Item6.jpg SUBSTANCE RELATIVE PH RANGE CHEMISTRY IN CONTEXT ACID/BASE WORKSHEET, PAGE 3 NOVEMBER 14, 2006 DIRECTIONS: NAME PART C -- INTERACTIVE LAB A titration is an experiment where an acid and base are mixed and their pH is studied as they react with one another. 1) Access the web site below and SCROLL DOWN to the Acid-Base Titration Lab box. 2) Type your name and click NEXT. 3) As you proceed, ONLY CHANGE SELECTIONS WHEN DIRECTED by this handout. 4) Answer the questions below with SHORT ANSWERS as you get to each step and click NEXT to go to the next step. http://lrs.ed.uiuc.edu/students/mihyewon/chemlab_experiment.html Step 1 :: What acid are you using? How much? Step 2 :: What base are you using? How much? Step 3 :: Select a color indicator that you would like to use. Step 4 :: Record the initial pH of the flask. Record the initial color of your flask. Move the speed bar to 1/2 way between slow and fast and WATCH and WAIT for the titration to end. At what pH does the color start changing? Record the final pH of the flask. Record the final color of the flask. CHEMISTRY IN CONTEXT ACID/BASE WORKSHEET, PAGE 4 NOVEMBER 14, 2006 Step 5 :: NAME Sketch a picture of your titration curve below: 14 10 pH 7 4 0 0 10 20 30 40 50 STOP after Step 5 and answer the following questions: 1) Why do you think we use indicators that change colors when working with acids and bases? 2) According to your graph, how much base did it take to neutralize your acid? (i.e. make it a pH of 7) Look back Step 1 to see how much acid you started with. Now, which of your substances was stronger? DIRECTIONS: PART D – PRACTICE QUIZ Take the online quiz at the following link as PRACTICE. Record your score AND ALSO write into your notes ANY ITEMS from the quiz that you DID NOT KNOW. http://www.chem4kids.com/extras/quiz_reactacidbase/index.html
