File
advertisement
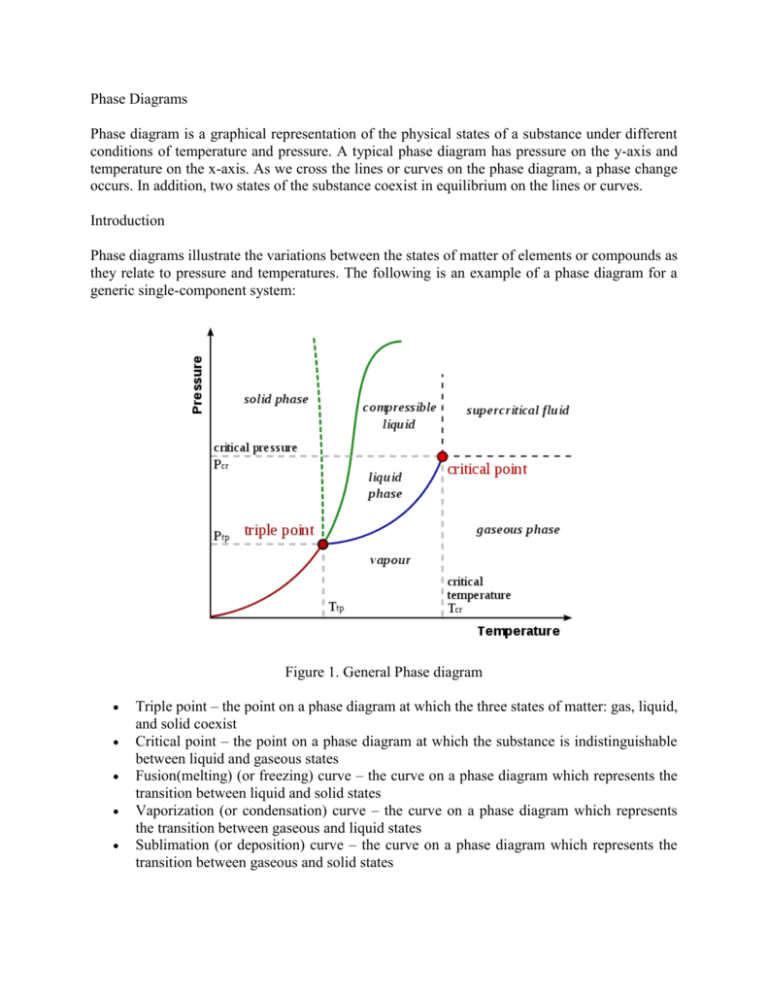
Phase Diagrams Phase diagram is a graphical representation of the physical states of a substance under different conditions of temperature and pressure. A typical phase diagram has pressure on the y-axis and temperature on the x-axis. As we cross the lines or curves on the phase diagram, a phase change occurs. In addition, two states of the substance coexist in equilibrium on the lines or curves. Introduction Phase diagrams illustrate the variations between the states of matter of elements or compounds as they relate to pressure and temperatures. The following is an example of a phase diagram for a generic single-component system: Figure 1. General Phase diagram Triple point – the point on a phase diagram at which the three states of matter: gas, liquid, and solid coexist Critical point – the point on a phase diagram at which the substance is indistinguishable between liquid and gaseous states Fusion(melting) (or freezing) curve – the curve on a phase diagram which represents the transition between liquid and solid states Vaporization (or condensation) curve – the curve on a phase diagram which represents the transition between gaseous and liquid states Sublimation (or deposition) curve – the curve on a phase diagram which represents the transition between gaseous and solid states Phase diagrams plot pressure (typically in atmospheres) versus temperature (typically in degrees Celsius or Kelvin). The labels on the graph represent the stable states of a system in equilibrium. The lines represent the combinations of pressures and temperatures at which two phases can exist in equilibrium. In other words, these lines define phase change points. The red line divides the solid and gas phases, represents sublimation (solid to gas) and deposition (gas to solid). The green line divides the solid and liquid phases and represents melting (solid to liquid) and freezing (liquid to solid). The blue divides the liquid and gas phases, represents vaporization (liquid to gas) and condensation (gas to liquid). There are also two important points on the diagram, the triple point and the critical point. The triple point represents the combination of pressure and temperature that facilitates all phases of matter at equilibrium. The critical point terminates the liquid/gas phase line and relates to the critical pressure, the pressure above which a supercritical fluid forms. With most substances, the temperature and pressure related to the triple point lie below standard temperature and pressure and the pressure for the critical point lies above standard pressure. Therefore at standard pressure as temperature increases, most substances change from solid to liquid to gas, and at standard temperature as pressure increases, most substances change from gas to liquid to solid. Exception Normally the solid/liquid phase line slopes positively to the right (as in the diagram for carbon dioxide below). However for other substances, notably water, the line slopes to the left as the diagram for water shows. This indicates that the liquid phase is more dense than the solid phase. This phenomenon is caused by the crystal structure of the solid phase. In the solid forms of water and some other substances, the molecules crystalize in a lattice with greater average space between molecules, thus resulting in a solid with a lower density than the liquid. Because of this phenomenon, one is able to melt ice simply by applying pressure and not by adding heat. Figure 2. Phase diagrams for CO2 (left) and for H2O (right) Moving About the Diagram Moving about the phase diagram reveals information about the phases of matter. Moving along a constant temperature line reveals relative densities of the phases. When moving from the bottom of the diagram to the top, the relative density increases. Moving along a constant pressure line reveals relative energies of the phases. When moving from the left of the diagram to the right, the relative energies increases. Important Definitions Sublimation is when the substance goes directly from solid to the gas state. Deposition occurs when a substance goes from a gas state to a solid state; it is the reverse process of sublimation. Melting occurs when a substance goes from a solid to a liquid state. Fusion is when a substance goes from a liquid to a solid state, the reverse of melting. Vaporization (or evaporation) is when a substance goes from a liquid to a gaseous state. Condensation occurs when a substance goes from a gaseous to a liquid state, the reverse of vaporization. Critical Point – the point in temperature and pressure on a phase diagram where the liquid and gaseous phases of a substance merge together into a single phase. Beyond the temperature of the critical point, the merged single phase is known as a supercritical fluid. Triple Point occurs when both the temperature and pressure of the three phases of the substance coexist in equilibrium. Imagine a substance with the following points on the phase diagram: a triple point at .5 atm and 5°C; a normal melting point at 20°C; a normal boiling point at 150°C; and a critical point at 5 atm and 1000°C. The solid liquid line is "normal" (meaning positive sloping). For this, complete the following: 1. 2. 3. 4. 5. 6. 7. 8. Roughly sketch the phase diagram, using units of atmosphere and Kelvin. Rank the states with respect to increasing density and increasing energy. Describe what one would see at pressures and temperatures above 5 atm and 1000°C. Describe what will happen to the substance when it begins in a vaccum at -15°C and is slowly pressurized. Describe the phase changes from -80°C to 500°C at 2 atm. What exists in a system that is at 1 atm and 150°? Label the area 1, 2, 3, and 4 and points O and C on the diagram. A sample of dry ice (solid CO2) is cooled to -100 °C, and is set on a table at room temperature (25 °C). At what temperature is the rate of sublimation and deposition the same? (Assume pressure is held constant -1 atm) Answers 1. 1-solid, 2-liquid, 3-gas, 4-supercritical fluid, point O-triple point, C-critical point 2. -78.5 °C (The phase of dry ice changes from solid to gas at -78.5 °C) 3. One would see a super-critical fluid, when approaching the point, one would see the meniscus between the liquid and gas disappear. 4. The substance would begin as a gas and as the pressure increases, it would compress and eventually solidify without liquefying as the temperature is below the triple point temperature. 5. The substance would melt at somewhere around, but above 20°C and then boil at somewhere around, but above 150°C. It would not form a super-critical fluid as the neither the pressure nor temperature reach the critical pressure or temperature. 6. Depending on how much energy is in the system, there will be different amounts of liquid and gas at equilibrium. If just enough energy was added to raise the temperature of the liquid to 150°C, there will just be liquid. If more was added, there will be some liquid and some gas. If just enough energy was added to change the state of all of the liquid without raising the temperature of the gas, there
