Supplemental Digital Content to be made available online for
advertisement
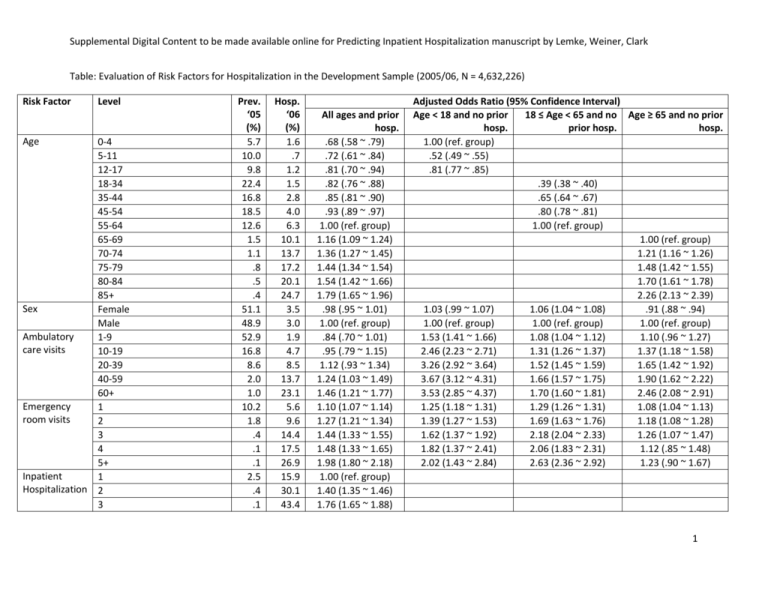
Supplemental Digital Content to be made available online for Predicting Inpatient Hospitalization manuscript by Lemke, Weiner, Clark Table: Evaluation of Risk Factors for Hospitalization in the Development Sample (2005/06, N = 4,632,226) Risk Factor Age Level 0-4 5-11 12-17 18-34 35-44 45-54 55-64 65-69 70-74 75-79 80-84 85+ Sex Female Male Ambulatory 1-9 care visits 10-19 20-39 40-59 60+ Emergency 1 room visits 2 3 4 5+ Inpatient 1 Hospitalization 2 3 Prev. ‘05 (%) 5.7 10.0 9.8 22.4 16.8 18.5 12.6 1.5 1.1 .8 .5 .4 51.1 48.9 52.9 16.8 8.6 2.0 1.0 10.2 1.8 .4 .1 .1 2.5 .4 .1 Hosp. ‘06 (%) 1.6 .7 1.2 1.5 2.8 4.0 6.3 10.1 13.7 17.2 20.1 24.7 3.5 3.0 1.9 4.7 8.5 13.7 23.1 5.6 9.6 14.4 17.5 26.9 15.9 30.1 43.4 All ages and prior hosp. .68 (.58 ~ .79) .72 (.61 ~ .84) .81 (.70 ~ .94) .82 (.76 ~ .88) .85 (.81 ~ .90) .93 (.89 ~ .97) 1.00 (ref. group) 1.16 (1.09 ~ 1.24) 1.36 (1.27 ~ 1.45) 1.44 (1.34 ~ 1.54) 1.54 (1.42 ~ 1.66) 1.79 (1.65 ~ 1.96) .98 (.95 ~ 1.01) 1.00 (ref. group) .84 (.70 ~ 1.01) .95 (.79 ~ 1.15) 1.12 (.93 ~ 1.34) 1.24 (1.03 ~ 1.49) 1.46 (1.21 ~ 1.77) 1.10 (1.07 ~ 1.14) 1.27 (1.21 ~ 1.34) 1.44 (1.33 ~ 1.55) 1.48 (1.33 ~ 1.65) 1.98 (1.80 ~ 2.18) 1.00 (ref. group) 1.40 (1.35 ~ 1.46) 1.76 (1.65 ~ 1.88) Adjusted Odds Ratio (95% Confidence Interval) Age < 18 and no prior 18 ≤ Age < 65 and no Age ≥ 65 and no prior hosp. prior hosp. hosp. 1.00 (ref. group) .52 (.49 ~ .55) .81 (.77 ~ .85) .39 (.38 ~ .40) .65 (.64 ~ .67) .80 (.78 ~ .81) 1.00 (ref. group) 1.00 (ref. group) 1.21 (1.16 ~ 1.26) 1.48 (1.42 ~ 1.55) 1.70 (1.61 ~ 1.78) 2.26 (2.13 ~ 2.39) 1.03 (.99 ~ 1.07) 1.06 (1.04 ~ 1.08) .91 (.88 ~ .94) 1.00 (ref. group) 1.00 (ref. group) 1.00 (ref. group) 1.53 (1.41 ~ 1.66) 1.08 (1.04 ~ 1.12) 1.10 (.96 ~ 1.27) 2.46 (2.23 ~ 2.71) 1.31 (1.26 ~ 1.37) 1.37 (1.18 ~ 1.58) 3.26 (2.92 ~ 3.64) 1.52 (1.45 ~ 1.59) 1.65 (1.42 ~ 1.92) 3.67 (3.12 ~ 4.31) 1.66 (1.57 ~ 1.75) 1.90 (1.62 ~ 2.22) 3.53 (2.85 ~ 4.37) 1.70 (1.60 ~ 1.81) 2.46 (2.08 ~ 2.91) 1.25 (1.18 ~ 1.31) 1.29 (1.26 ~ 1.31) 1.08 (1.04 ~ 1.13) 1.39 (1.27 ~ 1.53) 1.69 (1.63 ~ 1.76) 1.18 (1.08 ~ 1.28) 1.62 (1.37 ~ 1.92) 2.18 (2.04 ~ 2.33) 1.26 (1.07 ~ 1.47) 1.82 (1.37 ~ 2.41) 2.06 (1.83 ~ 2.31) 1.12 (.85 ~ 1.48) 2.02 (1.43 ~ 2.84) 2.63 (2.36 ~ 2.92) 1.23 (.90 ~ 1.67) 1 Supplemental Digital Content to be made available online for Predicting Inpatient Hospitalization manuscript by Lemke, Weiner, Clark Risk Factor Level Prev. ‘05 (%) .04 .04 Hosp. ‘06 (%) 51.7 62.2 Yes .05 46.1 1.30 (1.13 ~ 1.51) Yes .1 28.7 .87 (.78 ~ .97) 2.6 1.4 .2 .1 2.2 31.8 24.1 25.3 .73 11.7 19.4 34.4 46.8 12.2 1.0 1.4 3.1 2.2 .51 4 5+ Dialysis services Nursing services Major procedure Hospital dominant conditions Frailty condition Adjusted Clinical Groups Yes 1 2 3+ Yes Prospective ACG RUB Level 1 Prospective ACG RUB Level 2 Prospective ACG RUB Level 3 Pregnancy without Delivery 1732,1742,1752,1762,1772) 4220 4-5 Other ADG Combinations, Age 1 to 17, 1+ Major ADGs 4330 4-5 Other ADG Combinations, Age 18 to 44, 2+ Major ADGs 4420 4-5 Other ADG Combinations, Age 45+, 1 Major ADGs 4430 4-5 Other ADG Combinations, Age 45+, 2+ Major ADGs All ages and prior hosp. 1.99 (1.80 ~ 2.20) 2.35 (2.11 ~ 2.61) Adjusted Odds Ratio (95% Confidence Interval) Age < 18 and no prior 18 ≤ Age < 65 and no Age ≥ 65 and no prior hosp. prior hosp. hosp. 2.23 (1.82 ~ 2.75) 1.37 (1.05 ~ 1.78) 2.73 (.90 ~ 8.26) 1.12 (.79 ~ 1.60) .71 (.62 ~ .82) .76 (.74 ~ .79) 1.32 (1.27 ~ 1.38) 1.40 (1.31 ~ 1.50) 1.35 (1.23 ~ 1.49) 1.02 (.98 ~ 1.06) 1.00 (ref. group) .67 (.29 ~ 1.54) 1.01 (.44 ~ 2.33) 1.12 (.47 ~ 2.65) 1.12 (.93 ~ 1.34) 1.45 (.93 ~ 2.24) .09 (.01 ~ .92) 1.14 (1.03 ~ 1.25) 1.00 (ref. group) 1.11 (1.04 ~ 1.17) 1.48 (1.39 ~ 1.58) 1.11 (.63 ~ 1.95) 1.32 (1.26 ~ 1.38) 1.26 (1.12 ~ 1.43) .60 (.45 ~ .80) 1.31 (1.26 ~ 1.36) 1.00 (ref. group) 1.19 (1.15 ~ 1.23) 1.52 (1.47 ~ 1.57) 1.23 (1.12 ~ 1.34) 1.19 (1.11 ~ 1.29) .99 (.81 ~ 1.19) .48 (.33 ~ .69) 1.17 (1.10 ~ 1.24) 1.00 (ref. group) 1.14 (1.00 ~ 1.31) 1.31 (1.16 ~ 1.48) 2.4 1.33 (.56 ~ 3.15) 1.52 (1.36 ~ 1.70) .24 5.1 1.24 (.53 ~ 2.93) 2.17 (1.96 ~ 2.41) 2.12 6.5 1.26 (.54 ~ 2.94) 1.65 (1.57 ~ 1.73) .57 9.7 1.45 (.62 ~ 3.37) 1.98 (1.85 ~ 2.11) 2 Supplemental Digital Content to be made available online for Predicting Inpatient Hospitalization manuscript by Lemke, Weiner, Clark Risk Factor Level 4510 6-9 Other ADG Combinations, Age 1 to 5, no Major ADGs 4520 6-9 Other ADG Combinations, Age 1 to 5, 1+ Major ADGs 4610 6-9 Other ADG Combinations, Age 6 to 17, no Major ADGs 4620 6-9 Other ADG Combinations, Age 6 to 17, 1+ Major ADGs 4730 6-9 Other ADG Combinations, Males, Age 18 to 34, 2+ Major ADGs 4830 6-9 Other ADG Combinations, Females, Age 18 to 34, 2+ Major ADGs 4910 6-9 Other ADG Combinations, Age 35+, 0-1 Major ADGs 4920 6-9 Other ADG Combinations, Age 35+, 2 Major ADGs 4930 6-9 Other ADG Combinations, Age 35+, 3 Major ADGs Prev. ‘05 (%) Hosp. ‘06 (%) .19 2.7 .90 (.37 ~ 2.17) 1.19 (1.01 ~ 1.40) .21 4.1 1.37 (.59 ~ 3.22) 1.34 (1.16 ~ 1.55) .50 1.8 .71 (.29 ~ 1.76) 1.20 (1.05 ~ 1.36) .42 4.5 1.37 (.59 ~ 3.19) 1.70 (1.51 ~ 1.90) .15 6.6 1.21 (.51 ~ 2.83) 2.54 (2.23 ~ 2.89) .15 6.8 1.43 (.61 ~ 3.35) 2.54 (2.24 ~ 2.88) 6.16 6.3 1.22 (.53 ~ 2.83) 1.54 (1.48 ~ 1.60) 1.32 (1.17 ~ 1.50) 2.14 11.1 1.43 (.62 ~ 3.32) 1.79 (1.70 ~ 1.87) 1.58 (1.39 ~ 1.80) .59 16.1 1.58 (.68 ~ 3.66) 1.92 (1.79 ~ 2.06) 1.59 (1.38 ~ 1.84) All ages and prior hosp. Adjusted Odds Ratio (95% Confidence Interval) Age < 18 and no prior 18 ≤ Age < 65 and no Age ≥ 65 and no prior hosp. prior hosp. hosp. 3 Supplemental Digital Content to be made available online for Predicting Inpatient Hospitalization manuscript by Lemke, Weiner, Clark Risk Factor Level 4940 6-9 Other ADG Combinations, Age 35+, 4+ Major ADGs 5010 10+ Other ADG Combinations, Age 1 to 17, no Major ADGs 5020 10+ Other ADG Combinations, Age 1 to 17, 1 Major ADGs 5030 10+ Other ADG Combinations, Age 1 to 17, 2+ Major ADGs 5040 10+ Other ADG Combinations, Age 18+, 0-1 Major ADGs 5050 10+ Other ADG Combinations, Age 18+, 2 Major ADGs 5060 10+ Other ADG Combinations, Age 18+, 3 Major ADGs 5070 10+ Other ADG Combinations, Age 18+, 4+ Major ADGs 5322 Infants: 0-5 ADGs, 1+ Major ADGs, normal birth weight Prev. ‘05 (%) Hosp. ‘06 (%) .10 20.8 1.57 (.67 ~ 3.65) .05 4.2 .77 (.30 ~ 2.02) 1.47 (1.15 ~ 1.88) .08 7.4 1.24 (.53 ~ 2.92) 1.56 (1.29 ~ 1.88) .07 18.1 2.02 (.87 ~ 4.68) 1.16 (.93 ~ 1.45) 1.37 8.5 1.26 All ages and prior hosp. Adjusted Odds Ratio (95% Confidence Interval) Age < 18 and no prior 18 ≤ Age < 65 and no Age ≥ 65 and no prior hosp. prior hosp. hosp. 1.79 (1.52 ~ 2.12) 1.39 (1.12 ~ 1.74) 1.25 (.54 ~ 2.89) 1.59 (1.51 ~ 1.68) 1.31 (1.13 ~ 1.51) 13.9 1.36 (.59 ~ 3.15) 1.73 (1.64 ~ 1.83) 1.51 (1.31 ~ 1.73) .91 20.0 1.45 (.63 ~ 3.36) 1.73 (1.62 ~ 1.84) 1.48 (1.28 ~ 1.72) .75 32.6 1.44 (.62 ~ 3.35) 1.49 (1.37 ~ 1.62) 1.34 (1.14 ~ 1.57) .05 3.3 1.38 (.48 ~ 3.92) 2.75 (2.11 ~ 3.58) 4 Supplemental Digital Content to be made available online for Predicting Inpatient Hospitalization manuscript by Lemke, Weiner, Clark Risk Factor Level 5331 Infants: 6+ ADGs, no Major ADGs, low birth weight 5332 Infants: 6+ ADGs, no Major ADGs, normal birth weight 5341 Infants: 6+ ADGs, 1+ Major ADGs, low birth weight 5342 Infants: 6+ ADGs, 1+ Major ADGs, normal birth weight Expanded Diagnosis Clusters ADM03 Transplant Status ALL04 Asthma, w/o Status Asthmaticus ALL05 Asthma, w/ Status Asthmaticus ALL06 Disorders of the Immune System CAR03 Ischemic Heart Disease (Excluding Acute Myocardial Infarction) CAR04 Congenital Heart Disease CAR05 Congestive Heart Failure CAR06 Cardiac Valve Disorders Prev. ‘05 (%) Hosp. ‘06 (%) <.01 8.0 2.54 (.27 ~ 24.22) 5.80 (1.78 ~ 18.92) .08 4.4 1.10 (.42 ~ 2.90) 3.10 (2.57 ~ 3.73) .02 10.3 2.81 (1.14 ~ 6.90) 3.84 (2.65 ~ 5.56) .06 8.0 2.63 (1.13 ~ 6.15) 2.68 (2.16 ~ 3.32) .09 26.9 1.34 (1.19 ~ 1.51) 3.37 (2.01 ~ 5.66) 1.78 (1.56 ~ 2.02) 1.74 (1.25 ~ 2.43) 3.84 6.2 1.02 (.97 ~ 1.07) 1.22 (1.14 ~ 1.32) 1.07 (1.04 ~ 1.11) 1.04 (.96 ~ 1.12) .35 9.6 1.23 (1.12 ~ 1.35) 1.24 (1.02 ~ 1.49) 1.18 (1.07 ~ 1.30) .93 (.74 ~ 1.17) .30 18.3 1.05 (.98 ~ 1.14) 1.31 (.94 ~ 1.84) 1.07 (.98 ~ 1.17) 1.02 (.87 ~ 1.20) 2.49 17.8 1.19 (1.14 ~ 1.24) .45 (.12 ~ 1.67) 1.45 (1.40 ~ 1.50) 1.24 (1.18 ~ 1.29) .33 12.6 .99 (.91 ~ 1.07) 2.57 (2.22 ~ 2.96) 1.15 (1.03 ~ 1.28) .60 31.3 1.27 (1.21 ~ 1.34) 2.24 (1.19 ~ 4.21) 1.50 (1.39 ~ 1.61) 1.33 (1.25 ~ 1.42) 1.14 16.4 1.02 (.98 ~ 1.07) 1.39 (1.06 ~ 1.83) 1.09 (1.03 ~ 1.14) 1.14 (1.07 ~ 1.21) All ages and prior hosp. Adjusted Odds Ratio (95% Confidence Interval) Age < 18 and no prior 18 ≤ Age < 65 and no Age ≥ 65 and no prior hosp. prior hosp. hosp. 5 Supplemental Digital Content to be made available online for Predicting Inpatient Hospitalization manuscript by Lemke, Weiner, Clark Risk Factor Level CAR07 Cardiomyopathy CAR09 Cardiac Arrhythmia CAR10 Generalized Atherosclerosis CAR12 Acute Myocardial Infarction CAR13 Cardiac Arrest, Shock CAR14 Hypertension, w/o Major Complications CAR15 Hypertension, w/ Major Complications END02 Osteoporosis END06 Type 2 Diabetes, w/o Complication END07 Type 2 Diabetes, w/ Complication END08 Type 1 Diabetes, w/o Complication END09 Type 1 Diabetes, w/ Complication EYE03 Retinal Disorders (Excluding Diabetic Retinopathy) EYE13 Diabetic Retinopathy Prev. ‘05 (%) Hosp. ‘06 (%) .34 23.3 1.11 (1.04 ~ 1.19) 3.01 (1.82 ~ 4.96) 1.23 (1.13 ~ 1.33) 1.16 (1.05 ~ 1.28) 1.80 17.3 1.07 (1.03 ~ 1.11) 1.23 (.97 ~ 1.56) 1.18 (1.13 ~ 1.23) 1.15 (1.09 ~ 1.20) .72 21.2 1.11 (1.05 ~ 1.17) .86 (.31 ~ 2.39) 1.19 (1.12 ~ 1.26) 1.10 (1.04 ~ 1.17) .19 24.3 .99 (.93 ~ 1.06) .93 (.78 ~ 1.10) .68 (.55 ~ .83) .05 23.8 .73 (.65 ~ .83) 1.57 (.63 ~ 3.88) .67 (.48 ~ .95) .78 (.50 ~ 1.21) 12.53 9.6 1.09 (1.05 ~ 1.13) 1.39 (1.07 ~ 1.82) 1.21 (1.19 ~ 1.23) 1.04 (1.01 ~ 1.08) 1.31 15.4 .99 (.94 ~ 1.04) .93 (.47 ~ 1.85) 1.05 (1.01 ~ 1.10) 1.03 (.98 ~ 1.09) .91 11.0 1.05 (.98 ~ 1.12) .80 (.76 ~ .85) .86 (.81 ~ .91) 2.85 8.8 1.23 (1.17 ~ 1.30) 1.11 (.64 ~ 1.91) 1.33 (1.29 ~ 1.37) 1.19 (1.13 ~ 1.25) .68 21.5 1.13 (1.07 ~ 1.19) 2.61 (.32 ~ 21.35) 1.27 (1.19 ~ 1.35) 1.17 (1.09 ~ 1.25) .52 10.4 1.15 (1.04 ~ 1.27) 2.92 (2.36 ~ 3.60) 1.53 (1.45 ~ 1.63) 1.23 (1.10 ~ 1.38) .25 29.1 1.33 (1.24 ~ 1.44) 3.48 (1.93 ~ 6.29) 1.38 (1.26 ~ 1.51) 1.36 (1.21 ~ 1.53) .86 10.4 .95 (.88 ~ 1.03) 1.19 (.88 ~ 1.62) 1.02 (.97 ~ 1.08) .96 (.90 ~ 1.02) .34 17.8 1.10 (1.00 ~ 1.21) .33 (.05 ~ 2.42) 1.23 (1.15 ~ 1.33) 1.09 (.98 ~ 1.20) All ages and prior hosp. Adjusted Odds Ratio (95% Confidence Interval) Age < 18 and no prior 18 ≤ Age < 65 and no Age ≥ 65 and no prior hosp. prior hosp. hosp. 6 Supplemental Digital Content to be made available online for Predicting Inpatient Hospitalization manuscript by Lemke, Weiner, Clark Risk Factor Level Prev. ‘05 (%) Hosp. ‘06 (%) .30 16.8 1.08 (.97 ~ 1.20) .35 11.3 1.28 (1.16 ~ 1.40) GAS04 Acute Hepatitis .21 12.2 GAS05 Chronic Liver Disease .51 GAS06 Peptic Ulcer Disease GAS10 Diverticular Disease of Colon EYE15 Age-related Macular Degeneration GAS02 Inflammatory Bowel Disease All ages and prior hosp. Adjusted Odds Ratio (95% Confidence Interval) Age < 18 and no prior 18 ≤ Age < 65 and no Age ≥ 65 and no prior hosp. prior hosp. hosp. .92 (.80 ~ 1.05) 1.06 (1.00 ~ 1.13) 2.92 (2.04 ~ 4.17) 1.62 (1.50 ~ 1.74) 1.19 (.99 ~ 1.42) 1.08 (.96 ~ 1.20) 1.79 (.89 ~ 3.60) 1.10 (1.00 ~ 1.22) .85 (.63 ~ 1.14) 14.6 1.04 (.97 ~ 1.11) .63 (.30 ~ 1.29) 1.12 (1.05 ~ 1.19) 1.34 (1.13 ~ 1.57) 2.08 10.1 1.11 (1.06 ~ 1.16) 1.31 (1.14 ~ 1.52) 1.18 (1.14 ~ 1.22) 1.09 (1.02 ~ 1.17) 1.40 11.1 1.10 (1.04 ~ 1.15) 1.07 (1.02 ~ 1.11) 1.01 (.95 ~ 1.07) GAS11 Acute Pancreatitis .11 22.7 1.12 (1.01 ~ 1.23) 3.17 (1.23 ~ 8.20) 1.34 (1.13 ~ 1.60) .77 (.53 ~ 1.13) GAS12 Chronic Pancreatitis .06 25.6 1.24 (1.09 ~ 1.42) .37 (.11 ~ 1.27) 1.50 (1.23 ~ 1.82) 1.05 (.73 ~ 1.51) GSI08 Edema GSU11 Peripheral Vascular Disease 1.06 15.3 1.06 (1.01 ~ 1.12) 1.05 (.67 ~ 1.64) 1.14 (1.09 ~ 1.19) 1.17 (1.10 ~ 1.25) .27 27.3 1.14 (1.06 ~ 1.23) 1.29 (.17 ~ 9.92) 1.36 (1.24 ~ 1.50) 1.39 (1.29 ~ 1.51) .15 23.2 1.07 (.97 ~ 1.17) .90 (.26 ~ 3.14) 1.32 (1.15 ~ 1.51) 1.24 (1.11 ~ 1.38) .55 15.5 1.10 (1.04 ~ 1.16) 1.32 (.92 ~ 1.90) 1.02 (.94 ~ 1.10) .96 (.84 ~ 1.09) .04 8.6 1.67 (1.25 ~ 2.22) 1.75 (1.32 ~ 2.32) 1.14 (.74 ~ 1.75) 1.21 10.5 .93 (.87 ~ .99) 1.11 (.15 ~ 8.43) 1.10 (1.05 ~ 1.15) GSU13 Aortic Aneurysm GSU14 Gastrointestinal Obstruction/Perforation GTC01 Chromosomal Anomalies GUR04 Prostatic Hypertrophy 1.01 (.95 ~ 1.07) 7 Supplemental Digital Content to be made available online for Predicting Inpatient Hospitalization manuscript by Lemke, Weiner, Clark Risk Factor Level Prev. ‘05 (%) Hosp. ‘06 (%) HEM01 Hemolytic Anemia .07 15.8 1.58 (1.35 ~ 1.84) 4.60 (3.39 ~ 6.23) 1.32 (1.09 ~ 1.59) .71 (.46 ~ 1.09) HEM03 Thrombophlebitis .24 15.8 .87 (.80 ~ .95) 1.27 (.43 ~ 3.77) 1.17 (1.05 ~ 1.29) .85 (.72 ~ 1.01) HEM05 Aplastic Anemia HEM06 Deep Vein Thrombosis HEM07 Hemophilia, Coagulation Disorder .05 32.3 1.01 (.89 ~ 1.14) .44 (.09 ~ 2.15) 1.08 (.85 ~ 1.36) .99 (.73 ~ 1.33) .28 19.6 .99 (.91 ~ 1.06) 2.21 (.95 ~ 5.13) 1.07 (.97 ~ 1.18) 1.09 (.95 ~ 1.26) .17 19.7 1.00 (.92 ~ 1.09) 2.01 (1.27 ~ 3.16) 1.21 (1.07 ~ 1.37) .90 (.76 ~ 1.06) INF04 HIV, AIDS .08 9.1 1.12 (.88 ~ 1.43) 1.64 (1.42 ~ 1.90) .59 (.21 ~ 1.71) INF08 Septicemia MAL02 Low Impact Malignant Neoplasms MAL03 High Impact Malignant Neoplasms MAL04 Malignant Neoplasms, Breast MAL06 Malignant Neoplasms, Ovary MAL07 Malignant Neoplasms, Esophagus MAL08 Malignant Neoplasms, Kidney MAL09 Malignant Neoplasms, Liver and Biliary Tract .18 27.1 .96 (.90 ~ 1.02) 1.35 (.96 ~ 1.89) .61 (.48 ~ .79) .85 (.65 ~ 1.12) .36 16.8 1.08 (1.00 ~ 1.17) .90 (.51 ~ 1.59) 1.28 (1.19 ~ 1.38) 1.11 (.99 ~ 1.26) .31 27.7 1.53 (1.43 ~ 1.65) 3.45 (2.16 ~ 5.52) 1.95 (1.80 ~ 2.11) 1.23 (1.07 ~ 1.40) .50 12.1 1.01 (.93 ~ 1.11) 2.76 (.30 ~ 25.78) 1.22 (1.15 ~ 1.30) 1.03 (.94 ~ 1.13) .05 18.4 1.22 (1.02 ~ 1.45) 1.83 (1.53 ~ 2.17) 1.24 (.89 ~ 1.71) .01 32.7 1.28 (.97 ~ 1.68) 1.69 (1.14 ~ 2.49) .92 (.53 ~ 1.60) .05 21.3 1.12 (.96 ~ 1.31) 1.61 (1.33 ~ 1.95) 1.27 (.98 ~ 1.64) .02 38.7 1.36 (1.11 ~ 1.66) 2.04 (1.50 ~ 2.78) 1.16 (.68 ~ 1.98) All ages and prior hosp. Adjusted Odds Ratio (95% Confidence Interval) Age < 18 and no prior 18 ≤ Age < 65 and no Age ≥ 65 and no prior hosp. prior hosp. hosp. 1.95 (.45 ~ 8.39) 8 Supplemental Digital Content to be made available online for Predicting Inpatient Hospitalization manuscript by Lemke, Weiner, Clark Risk Factor Level MAL10 Malignant Neoplasms, Lung MAL11 Malignant Neoplasms, Lymphomas MAL12 Malignant Neoplasms, Colorectal MAL13 Malignant Neoplasms, Pancreas MAL14 Malignant Neoplasms, Prostate MAL15 Malignant Neoplasms, Stomach MAL16 Acute Leukemia MAL18 Malignant Neoplasms, Bladder MUS03 Degenerative Joint Disease MUS10 Fracture of Neck of Femur (Hip) MUS14 Low Back Pain MUS16 Amputation Status NUR03 Peripheral Neuropathy, Neuritis NUR05 Cerebrovascular Disease Prev. ‘05 (%) Hosp. ‘06 (%) .09 32.5 1.20 (1.08 ~ 1.34) .15 16.5 1.09 (.97 ~ 1.23) .15 21.5 .02 All ages and prior hosp. Adjusted Odds Ratio (95% Confidence Interval) Age < 18 and no prior 18 ≤ Age < 65 and no Age ≥ 65 and no prior hosp. prior hosp. hosp. 1.73 (1.49 ~ 2.00) 1.51 (1.28 ~ 1.77) 1.39 (1.25 ~ 1.56) 1.19 (1.00 ~ 1.41) 1.11 (1.01 ~ 1.22) 1.83 (1.63 ~ 2.05) 1.18 (1.03 ~ 1.34) 35.0 1.20 (.95 ~ 1.51) 1.70 (1.20 ~ 2.41) .93 (.55 ~ 1.56) .31 15.0 .85 (.77 ~ .93) 1.40 (1.27 ~ 1.55) .98 (.91 ~ 1.06) .01 29.7 1.01 (.78 ~ 1.30) 1.28 (.87 ~ 1.89) 1.62 (.97 ~ 2.70) .03 24.2 1.55 (1.26 ~ 1.92) 1.16 (.84 ~ 1.60) .67 (.36 ~ 1.25) .08 19.7 1.11 (.95 ~ 1.29) 1.39 (1.17 ~ 1.65) 1.25 (1.07 ~ 1.45) 3.21 13.1 1.16 (1.11 ~ 1.21) 1.01 (.53 ~ 1.93) 1.64 (1.60 ~ 1.68) 1.32 (1.27 ~ 1.38) .06 22.8 1.05 (.91 ~ 1.20) .89 (.32 ~ 2.47) 1.45 (1.15 ~ 1.83) .89 (.74 ~ 1.07) 12.08 5.6 1.07 (1.03 ~ 1.10) .96 (.88 ~ 1.05) 1.11 (1.09 ~ 1.13) 1.11 (1.06 ~ 1.15) .05 6.5 .90 (.75 ~ 1.07) 1.75 (.82 ~ 3.74) 1.17 (.94 ~ 1.44) 1.11 (.76 ~ 1.63) 3.51 9.0 1.07 (1.03 ~ 1.12) 1.04 (.84 ~ 1.30) 1.08 (1.05 ~ 1.10) 1.04 (.98 ~ 1.09) .96 20.1 1.02 (.97 ~ 1.06) 1.22 (.79 ~ 1.87) 1.13 (1.07 ~ 1.20) 1.19 (1.13 ~ 1.25) 1.49 (.68 ~ 3.29) 1.44 (.73 ~ 2.81) 9 Supplemental Digital Content to be made available online for Predicting Inpatient Hospitalization manuscript by Lemke, Weiner, Clark Risk Factor Level Prev. ‘05 (%) Hosp. ‘06 (%) NUR06 Parkinson's Disease .29 13.9 1.09 (.99 ~ 1.21) 1.24 (.62 ~ 2.49) 1.22 (1.12 ~ 1.32) 1.35 (1.22 ~ 1.50) NUR07 Seizure Disorder .64 12.1 1.18 (1.10 ~ 1.26) 1.86 (1.63 ~ 2.12) 1.49 (1.39 ~ 1.58) 1.23 (1.07 ~ 1.40) NUR08 Multiple Sclerosis .17 9.6 1.18 (1.01 ~ 1.38) 1.31 (.40 ~ 4.28) 1.23 (1.11 ~ 1.35) 1.23 (.88 ~ 1.73) NUR09 Muscular Dystrophy NUR11 Dementia and Delirium NUR12 Quadriplegia and Paraplegia .05 15.1 1.06 (.86 ~ 1.31) 1.51 (.78 ~ 2.91) 1.25 (1.03 ~ 1.53) .94 (.62 ~ 1.41) .31 24.4 1.02 (.95 ~ 1.09) 1.32 (.87 ~ 2.01) .99 (.88 ~ 1.11) 1.27 (1.17 ~ 1.38) .04 24.7 1.43 (1.20 ~ 1.71) 2.39 (1.60 ~ 3.55) 1.97 (1.55 ~ 2.50) 1.37 (.77 ~ 2.43) NUR15 Head Injury NUR16 Spinal Cord Injury/Disorders NUR17 Paralytic Syndromes, Other .67 6.9 .94 (.87 ~ 1.03) .99 (.86 ~ 1.13) .91 (.83 ~ .99) .99 (.86 ~ 1.15) .17 16.2 1.16 (1.04 ~ 1.29) 2.63 (2.13 ~ 3.23) 1.41 (1.25 ~ 1.59) 1.37 (1.10 ~ 1.70) .12 21.6 .97 (.88 ~ 1.07) .61 (.35 ~ 1.06) 1.11 (.94 ~ 1.30) .88 (.71 ~ 1.10) NUR18 Cerebral Palsy NUR19 Developmental Disorder NUT02 Nutritional Deficiencies .05 12.7 1.57 (1.23 ~ 1.99) 2.66 (2.03 ~ 3.48) 1.37 (.99 ~ 1.89) .28 5.0 1.29 (1.10 ~ 1.51) .83 (.72 ~ .95) 1.27 (1.02 ~ 1.58) .36 17.1 1.05 (.98 ~ 1.13) 1.18 (.87 ~ 1.59) 1.07 (.98 ~ 1.16) 1.07 (.94 ~ 1.21) 5.21 6.3 1.05 (1.00 ~ 1.09) 1.24 (1.15 ~ 1.34) 1.03 (1.01 ~ 1.06) .93 (.86 ~ 1.01) .72 13.3 1.28 (1.21 ~ 1.36) 1.63 (1.33 ~ 2.00) 1.50 (1.42 ~ 1.59) 1.09 (.87 ~ 1.36) PSY01 Anxiety, Neuroses PSY02 Substance Use All ages and prior hosp. Adjusted Odds Ratio (95% Confidence Interval) Age < 18 and no prior 18 ≤ Age < 65 and no Age ≥ 65 and no prior hosp. prior hosp. hosp. 10 Supplemental Digital Content to be made available online for Predicting Inpatient Hospitalization manuscript by Lemke, Weiner, Clark Risk Factor Level Prev. ‘05 (%) Hosp. ‘06 (%) 1.56 8.9 1.00 (.96 ~ 1.05) 1.07 (.73 ~ 1.56) 1.11 (1.06 ~ 1.15) 1.41 2.9 1.00 (.88 ~ 1.13) 1.27 (1.17 ~ 1.37) .97 (.90 ~ 1.04) .43 12.4 1.06 (.98 ~ 1.14) 1.48 (1.27 ~ 1.72) 1.20 (1.10 ~ 1.31) .97 (.81 ~ 1.16) .12 14.1 1.11 (.99 ~ 1.26) .83 (.48 ~ 1.43) .89 (.77 ~ 1.04) .74 (.54 ~ 1.02) 4.59 7.7 1.08 (1.03 ~ 1.12) 1.62 (1.47 ~ 1.80) 1.20 (1.17 ~ 1.23) 1.09 (1.02 ~ 1.18) PSY12 Bipolar Disorder .47 12.1 1.15 (1.06 ~ 1.25) 2.01 (1.68 ~ 2.41) 1.68 (1.58 ~ 1.79) 1.17 (.91 ~ 1.52) REC01 Cleft Lip and Palate REC03 Chronic Ulcer of the Skin REC04 Burns--2nd and 3rd Degree .02 10.5 1.26 (.81 ~ 1.97) 6.36 (4.81 ~ 8.42) 2.66 (1.28 ~ 5.56) .28 24.2 1.20 (1.11 ~ 1.30) 1.28 (.67 ~ 2.44) 1.42 (1.31 ~ 1.55) 1.17 (1.06 ~ 1.29) .24 5.4 1.05 (.87 ~ 1.28) 1.16 (.91 ~ 1.49) 1.12 (1.00 ~ 1.26) 1.10 (.81 ~ 1.50) REN01 Chronic Renal Failure REN02 Fluid/Electrolyte Disturbances .35 30.5 1.34 (1.25 ~ 1.44) 3.30 (1.86 ~ 5.85) 1.62 (1.48 ~ 1.77) 1.23 (1.12 ~ 1.34) 1.58 16.8 1.05 (1.01 ~ 1.09) 1.11 (.96 ~ 1.28) 1.13 (1.08 ~ 1.19) .99 (.92 ~ 1.07) REN03 Acute Renal Failure .14 35.0 .77 (.71 ~ .84) .79 (.10 ~ 6.28) .54 (.43 ~ .68) .74 (.60 ~ .91) REN04 Nephritis, Nephrosis RES02 Acute Lower Respiratory Tract Infection .12 20.7 1.11 (.99 ~ 1.25) 1.36 (.75 ~ 2.46) 1.03 (.91 ~ 1.18) 1.10 (.90 ~ 1.35) 8.84 6.4 1.12 (1.08 ~ 1.16) 1.22 (1.15 ~ 1.29) 1.19 (1.16 ~ 1.21) 1.07 (1.02 ~ 1.12) PSY03 Tobacco Use PSY05 Attention Deficit Disorder PSY07 Schizophrenia and Affective Psychosis PSY08 Personality Disorders PSY09 Depression All ages and prior hosp. Adjusted Odds Ratio (95% Confidence Interval) Age < 18 and no prior 18 ≤ Age < 65 and no Age ≥ 65 and no prior hosp. prior hosp. hosp. 11 Supplemental Digital Content to be made available online for Predicting Inpatient Hospitalization manuscript by Lemke, Weiner, Clark Risk Factor Level Prev. ‘05 (%) Hosp. ‘06 (%) All ages and prior hosp. Adjusted Odds Ratio (95% Confidence Interval) Age < 18 and no prior 18 ≤ Age < 65 and no Age ≥ 65 and no prior hosp. prior hosp. hosp. RES03 Cystic Fibrosis RES04 Emphysema, Chronic Bronchitis, COPD .02 22.4 3.83 (2.87 ~ 5.12) 5.87 (3.83 ~ 9.00) 2.73 (1.95 ~ 3.84) .28 (.03 ~ 2.43) 1.36 18.5 1.17 (1.12 ~ 1.23) 1.00 (.75 ~ 1.33) 1.31 (1.26 ~ 1.37) 1.34 (1.27 ~ 1.41) RES08 Pulmonary Embolism .10 22.5 .94 (.85 ~ 1.03) .97 (.80 ~ 1.16) .84 (.65 ~ 1.09) RES09 Tracheostomy .02 35.3 1.41 (1.19 ~ 1.66) 1.41 (.94 ~ 2.13) .62 (.30 ~ 1.30) RES10 Respiratory Failure RHU01 Autoimmune and Connective Tissue Diseases .70 22.1 .96 (.91 ~ 1.00) 1.33 (1.03 ~ 1.72) 1.12 (1.04 ~ 1.19) 1.12 (1.01 ~ 1.23) .60 11.1 1.10 (1.02 ~ 1.19) .95 (.58 ~ 1.57) 1.16 (1.09 ~ 1.22) 1.02 (.91 ~ 1.14) RHU05 Rheumatoid Arthritis TOX02 Adverse Effects of Medicinal Agents TOX04 Complications of Mechanical Devices .50 11.2 1.09 (1.00 ~ 1.20) 1.11 (.67 ~ 1.86) 1.13 (1.06 ~ 1.20) 1.21 (1.09 ~ 1.35) .52 10.9 .90 (.84 ~ .97) 1.07 (.87 ~ 1.32) .93 (.86 ~ 1.00) 1.07 (.93 ~ 1.23) .40 22.9 1.14 (1.08 ~ 1.21) 1.23 (.91 ~ 1.66) 1.12 (1.03 ~ 1.22) 1.24 (1.09 ~ 1.41) 12
