Gapfill 2.16.2
advertisement
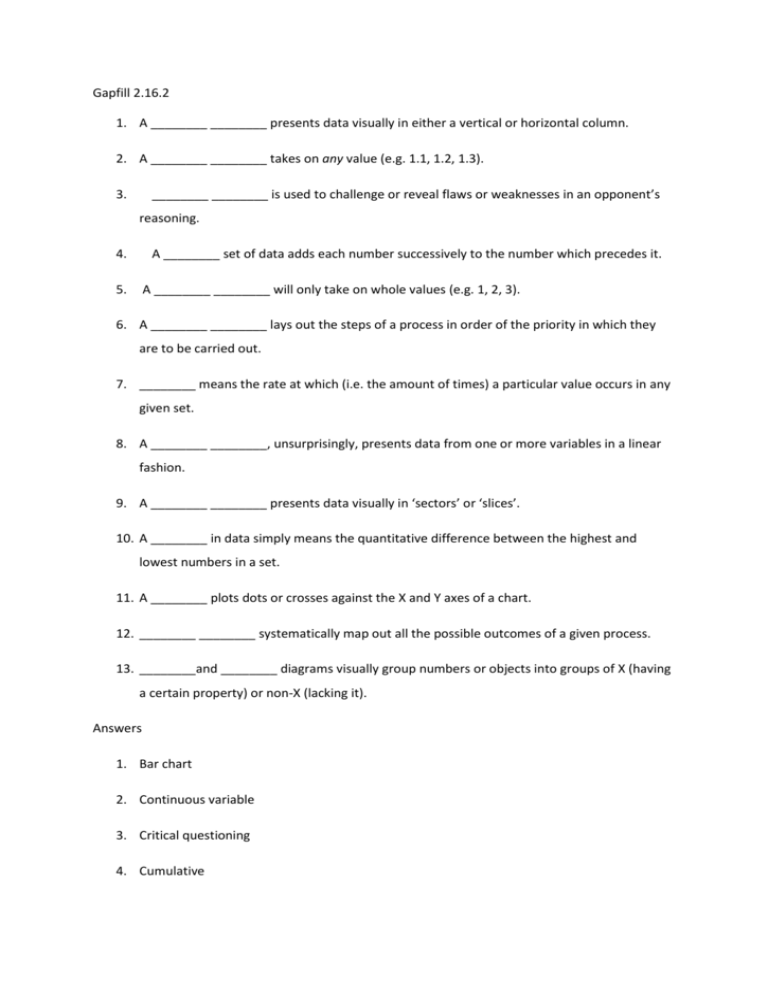
Gapfill 2.16.2 1. A ________ ________ presents data visually in either a vertical or horizontal column. 2. A ________ ________ takes on any value (e.g. 1.1, 1.2, 1.3). 3. ________ ________ is used to challenge or reveal flaws or weaknesses in an opponent’s reasoning. 4. A ________ set of data adds each number successively to the number which precedes it. 5. A ________ ________ will only take on whole values (e.g. 1, 2, 3). 6. A ________ ________ lays out the steps of a process in order of the priority in which they are to be carried out. 7. ________ means the rate at which (i.e. the amount of times) a particular value occurs in any given set. 8. A ________ ________, unsurprisingly, presents data from one or more variables in a linear fashion. 9. A ________ ________ presents data visually in ‘sectors’ or ‘slices’. 10. A ________ in data simply means the quantitative difference between the highest and lowest numbers in a set. 11. A ________ plots dots or crosses against the X and Y axes of a chart. 12. ________ ________ systematically map out all the possible outcomes of a given process. 13. ________and ________ diagrams visually group numbers or objects into groups of X (having a certain property) or non-X (lacking it). Answers 1. Bar chart 2. Continuous variable 3. Critical questioning 4. Cumulative 5. Discrete variable 6. Flow chart 7. Frequency 8. Line graph 9. Pie chart 10. Range 11. Scattergraph 12. Tree diagrams 13. Venn, Carroll

