TESTING HYPOTHESES USING EXPERIMENTS
advertisement

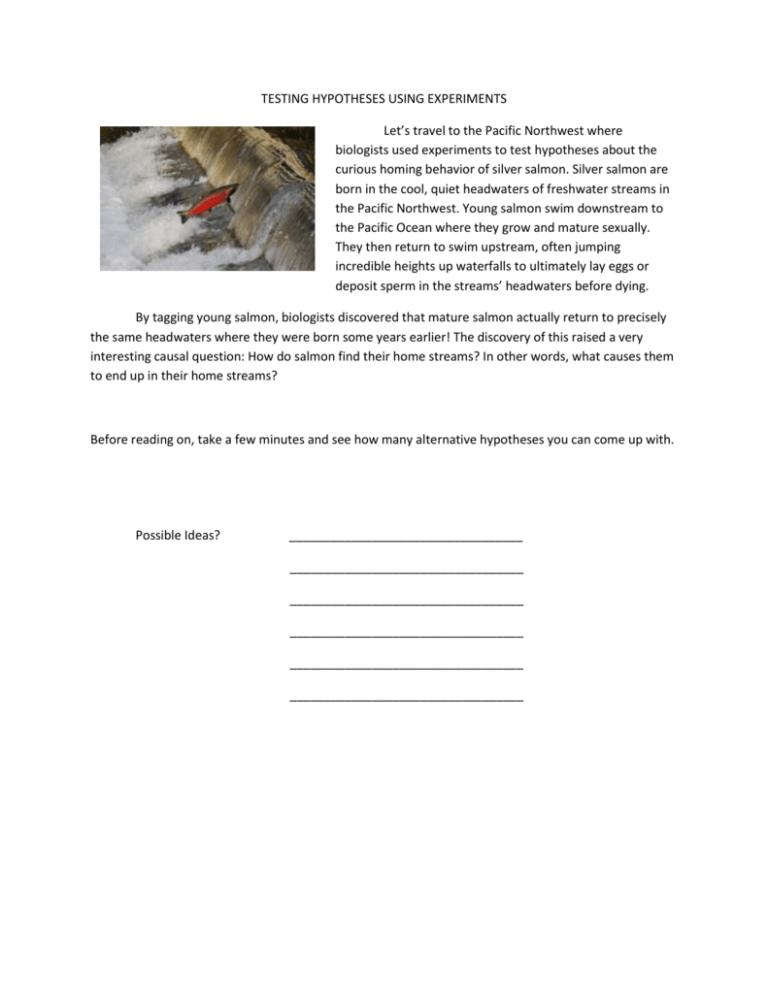
TESTING HYPOTHESES USING EXPERIMENTS Let’s travel to the Pacific Northwest where biologists used experiments to test hypotheses about the curious homing behavior of silver salmon. Silver salmon are born in the cool, quiet headwaters of freshwater streams in the Pacific Northwest. Young salmon swim downstream to the Pacific Ocean where they grow and mature sexually. They then return to swim upstream, often jumping incredible heights up waterfalls to ultimately lay eggs or deposit sperm in the streams’ headwaters before dying. By tagging young salmon, biologists discovered that mature salmon actually return to precisely the same headwaters where they were born some years earlier! The discovery of this raised a very interesting causal question: How do salmon find their home streams? In other words, what causes them to end up in their home streams? Before reading on, take a few minutes and see how many alternative hypotheses you can come up with. Possible Ideas? __________________________________ __________________________________ __________________________________ __________________________________ __________________________________ __________________________________ A number of alternative hypotheses can be proposed. For instance, people often navigate by sight. Perhaps salmon do as well. Returning salmon may recall objects, such as large rocks, they saw while swimming downstream. Studies of migratory animals also suggest possibilities. For example, migratory eels are known to be enormously sensitive to dissolved chemicals. Perhaps salmon are as well. Perhaps they swim a short distance into various streams until they find the one that smells right, and they then follow the chemical path home. Let’s try to make sense of this by filling in a graphic organizer: The Guiding Question Hypothesis 1 Hypothesis 2 Now we have to think of how we could test this. What if we could do something to the fish to see if it Hypothesis 1 or 2 was correct. What could we do? If we did this, what data would we collect? What would your data table look like? How would we analyze this data? If we plotted our data into a graph, what kind of graph would we use? Why? Draw a sample graph – be sure to label the X and Y axis and put a title on it. What would your graph look like if: Hypothesis 1 was correct? How will you know which hypothesis was correct? Hypothesis 2 was correct?


