SOFTS COMMENTS Jack Scoville
advertisement
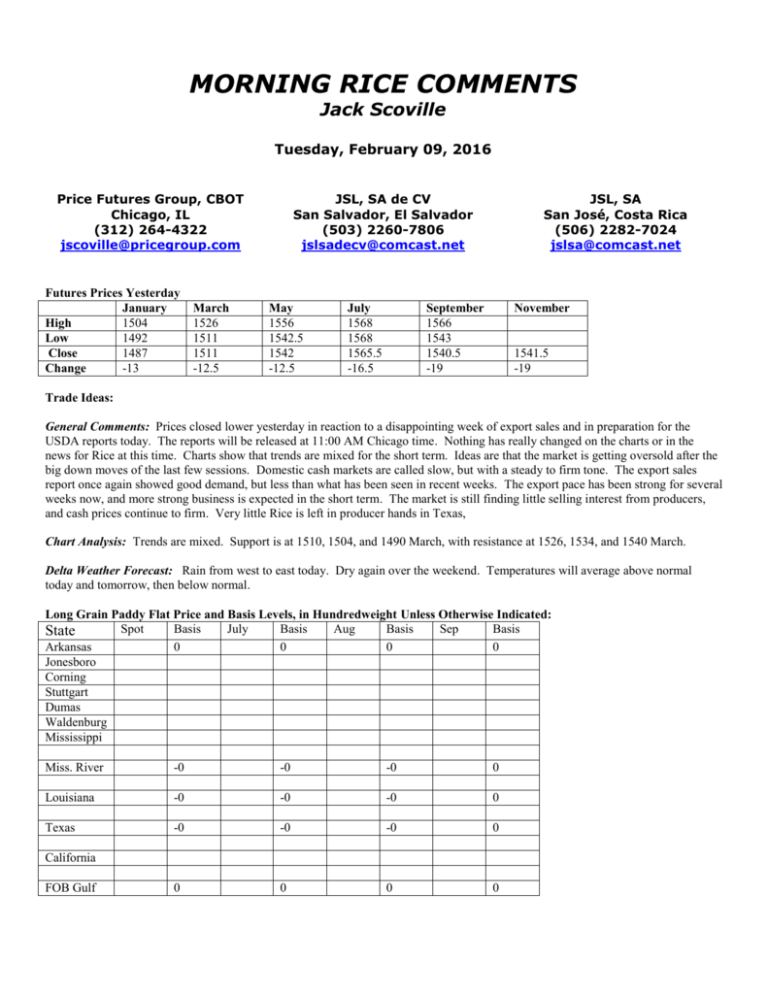
MORNING RICE COMMENTS Jack Scoville Tuesday, February 09, 2016 Price Futures Group, CBOT Chicago, IL (312) 264-4322 jscoville@pricegroup.com Futures Prices Yesterday January 1504 High 1492 Low 1487 Close -13 Change March 1526 1511 1511 -12.5 JSL, SA de CV San Salvador, El Salvador (503) 2260-7806 jslsadecv@comcast.net May 1556 1542.5 1542 -12.5 July 1568 1568 1565.5 -16.5 JSL, SA San José, Costa Rica (506) 2282-7024 jslsa@comcast.net September 1566 1543 1540.5 -19 November 1541.5 -19 Trade Ideas: General Comments: Prices closed lower yesterday in reaction to a disappointing week of export sales and in preparation for the USDA reports today. The reports will be released at 11:00 AM Chicago time. Nothing has really changed on the charts or in the news for Rice at this time. Charts show that trends are mixed for the short term. Ideas are that the market is getting oversold after the big down moves of the last few sessions. Domestic cash markets are called slow, but with a steady to firm tone. The export sales report once again showed good demand, but less than what has been seen in recent weeks. The export pace has been strong for several weeks now, and more strong business is expected in the short term. The market is still finding little selling interest from producers, and cash prices continue to firm. Very little Rice is left in producer hands in Texas, Chart Analysis: Trends are mixed. Support is at 1510, 1504, and 1490 March, with resistance at 1526, 1534, and 1540 March. Delta Weather Forecast: Rain from west to east today. Dry again over the weekend. Temperatures will average above normal today and tomorrow, then below normal. Long Grain Paddy Flat Price and Basis Levels, in Hundredweight Unless Otherwise Indicated: Spot Basis July Basis Aug Basis Sep Basis State Arkansas 0 0 0 0 Jonesboro Corning Stuttgart Dumas Waldenburg Mississippi Miss. River -0 -0 -0 0 Louisiana -0 -0 -0 0 Texas -0 -0 -0 0 0 0 0 0 California FOB Gulf Paddy News Items: DJ CBOT Delivery Intentions: Totals - Jan 11 Source: CME Group Contract Quantity Commodity Month Delivery Day Assigned Today SOYBEAN MEAL January Jan. 14, 2013 5 SOYBEAN OIL January Jan. 14, 2013 517 ROUGH RICE January Jan. 14, 2013 1 Next Trade Date Available Dec 14, 2012 Jan 09, 2013 Dec 31, 2012 DJ China Zhengzhou Rice Futures Closing Prices, Volume Product Settle PrevSettle Change Open High Low Volume ER301 2,593 2,593 0 0 0 0 0 ER303 2,665 2,665 0 0 0 0 0 ER305 2,707 2,708 -1 2,710 2,712 2,704 6,638 Notes: 1) Unit is Chinese yuan a metric ton; 2) Change is the day's settlement minus previous settlement; 3) Volume and open interest are in lots; 4) One lot is equivalent to 10 metric tons. Open Int 2,154 18 72,040 DJ SURVEY: Forecasts For US Dec 1 Grain Stocks Report CHICAGO (Dow Jones)--The following are analysts' estimates in billions of bushels for U.S. grain and soybean stocks as of Dec. 1, 2012, as compiled by Dow Jones. The U.S. Department of Agriculture is scheduled to release its report at 12:00 p.m. EST (1800 GMT) Friday. Parentheses denote the number of estimates in that average and range. 2012 Sept.1 2011 Dec.1 USDA USDA Average Range Stocks Stocks Corn (16) 8.210 8.050-8.450 0.988 9.647 Soybeans (16) 1.984 1.915-2.056 0.169 2.370 Wheat (15) 1.674 1.553-1.721 2.104 1.663 Corn Soybeans Wheat ABN Amro 8.450 1.993 1.705 ADM Investor Services 8.172 1.932 1.716 AgriSource 8.125 1.980 1.620 Agrivisor 8.395 1.955 1.655 Allendale 8.050 1.942 1.682 Doane Advisory Srv 8.259 1.959 1.685 Futures International 8.290 1.987 1.704 Jefferies Bache 8.353 2.002 1.643 Kropf/Love Consulting 8.207 1.994 1.667 Linn Group 8.105 2.017 1.553 Newedge USA 8.126 2.009 1.696 Prime Ag 8.100 2.000 1.700 Rice Dairy 8.228 1.915 1.671 RJ O'Brien 8.248 1.996 1.721 U.S. Commodities 8.120 2.005 n/a Water Street Solutions 8.130 2.056 1.696 DJ SURVEY: Annual US Corn, Soybean Production And Yield CHICAGO (Dow Jones)--The following are analysts' estimates in billions of bushels for 2012-13 U.S. soybean and corn production, as compiled by Dow Jones Newswires. The U.S. Department of Agriculture is scheduled to release its Annual Production report at 12:00 p.m. EST (1800 GMT) Friday. Parentheses denote the number of estimates in that average and range. Dec 2011 Average Range USDA Output Corn (22) 10.626 10.100-10.801 10.725 12.358 Soybeans (22) 2.999 2.922-3.104 2.971 3.094 YIELD: Corn (22) 122.4 121.0-123.4 122.3 147.2 Soybeans (22) 39.6 38.6-41.0 39.3 41.9 Corn Soybeans Crop Yield Crop Yield ABN Amro 10.675 122.0 3.028 40.0 ADM Investor Services 10.578 123.0 2.971 39.3 AgriSource 10.650 122.1 2.990 39.5 Agrivisor 10.684 122.8 2.944 38.9 Allendale 10.618 123.2 2.978 39.4 Alpari Citigroup Doane Advisory Srvcs Farm Futures Futures International Global Comm Analytics *Informa Jefferies Bache Kropf and Love Linn Group Newedge USA Prime Ag Consultants R.J. O'Brien Rice Dairy Risk Management Comm US Commodities Water Street Solutions *From traders 10.500 10.681 10.755 10.617 10.685 10.701 10.801 10.749 10.675 10.492 10.704 10.614 10.760 10.665 10.100 10.736 10.325 122.0 121.8 122.6 121.3 122.1 123.0 123.3 123.0 122.0 122.0 122.3 122.0 123.4 122.4 121.0 122.7 122.1 3.100 2.970 2.990 2.969 2.963 2.969 3.036 3.025 2.990 2.983 3.016 3.104 2.986 2.951 2.922 3.100 2.996 39.5 39.4 39.5 39.6 39.3 39.8 40.1 40.0 39.5 39.3 39.9 41.0 39.4 39.0 38.6 39.7 39.6 DJ SURVEY: January US Grain, Soybean Carryout CHICAGO (Dow Jones)--The following are analysts' estimates in billions of bushels for 2012-13 U.S. grain and soybean ending stocks, as compiled by Dow Jones Newswires. The U.S. Department of Agriculture is scheduled to release updated supply and demand tables at 12:00 p.m. EST (1800 GMT) Friday. Parentheses denote the number of estimates in that average and range. Dec 2012-13 2011-12 Average Range USDA USDA Corn (21) 0.667 0.489-0.764 0.647 0.988 Soybeans (21) 0.135 0.107-0.178 0.130 0.169 Wheat (19) 0.743 0.637-0.792 0.754 0.743 Corn Soybeans Wheat ABN Amro 0.697 0.130 0.779 ADM Investor Services 0.600 0.150 0.750 AgriSource 0.660 0.135 0.735 Agrivisor 0.656 0.130 0.704 Allendale 0.760 0.141 0.754 Alpari 0.550 0.130 0.770 Citigroup 0.649 0.130 0.750 Doane Advisory Srvcs 0.676 0.150 0.737 Futures International 0.648 0.133 0.732 Global Comm Analytics 0.764 0.107 0.706 Jefferies Bache 0.720 0.150 0.759 Kropf and Love 0.647 0.140 0.754 Linn Group 0.755 0.114 0.637 Midco 0.700 0.130 0.750 Newedge USA 0.647 0.140 0.769 Prime Ag Consultants 0.635 0.178 0.754 Rice Dairy 0.616 0.120 0.752 Risk Management Commodities 0.750 0.131 n/a RJ O'Brien 0.715 0.126 0.792 US Commodities 0.682 0.150 n/a Water Street Solutions 0.489 0.125 0.729 DJ SURVEY: USDA 2013-14 US Winter Wheat Seedings Report CHICAGO (Dow Jones)--The following are analysts' estimates in millions of acres for 2013-14 U.S. winter wheat seedings, as compiled by Dow Jones Newswires. The U.S. Department of Agriculture is scheduled to release its report at 12:00 p.m. EST (1800 GMT) Friday, Jan. 11. Parentheses denote the number of estimates in that average and range. Average Range 2012 Seedings All Winter Wheat (15) 42.6 41.7-44.7 41.3 Hard Red Winter (14) 30.3 29.9-31.0 29.9 Soft Red Winter (14) 8.9 8.2-10.0 8.1 White Winter (14) 3.5 3.3-3.9 3.3 All Hard Soft Winter Red Red White ABN Amro 43.1 30.0 9.7 3.4 ADM Investor Services 42.3 30.0 8.9 3.4 Agrivisor 44.7 31.0 10.0 3.7 Allendale 43.4 30.3 9.6 3.5 Doane Advisory Service Farm Futures Futures International Global Commod Analytics Jefferies Bache Kropf & Love Consulting Linn Group Newedge USA LLC Rice Dairy R.J. O'Brien Water Street Solutions 43.1 42.1 41.7 42.8 42.3 42.3 42.8 42.0 42.6 42.0 42.3 30.2 n/a 29.9 30.5 30.7 30.4 30.0 29.9 30.4 30.2 30.8 8.98 n/a 8.4 9.0 8.2 8.6 9.4 8.8 8.8 8.3 8.2 3.9 n/a 3.4 3.3 3.5 3.3 3.4 3.3 3.4 3.5 3.3 141 W. Jackson Blvd. Suite 1340A, Chicago, IL 60604 | (800) 769-7021 | (312) 264-4364 (Direct) | www.pricegroup.com Past performance is not indicative of future results. Investing in futures can involve substantial risk & is not for everyone. The information and data in this report were obtained from sources considered reliable. Their accuracy or completeness is not guaranteed and the giving of the same is not to be deemed as an offer or solicitation on our part with respect to the sale or purchase of any securities or futures. The Price Futures Group, its officers, directors, employees, and brokers may in the normal course of business have positions, which may or may not agree with the opinions expressed in this report. Any decision to purchase or sell as a result of the opinions expressed in this report will be the full responsibility of the person authorizing such transaction. Reproduction and/or distribution of any portion of this report are strictly prohibited without the written permission of the author. To SUBSCRIBE to Morning Rice please click here. To Unsubscribe from Morning Rice please click here.
