Table S1. Tissue sources of total RNA used for cDNA
advertisement
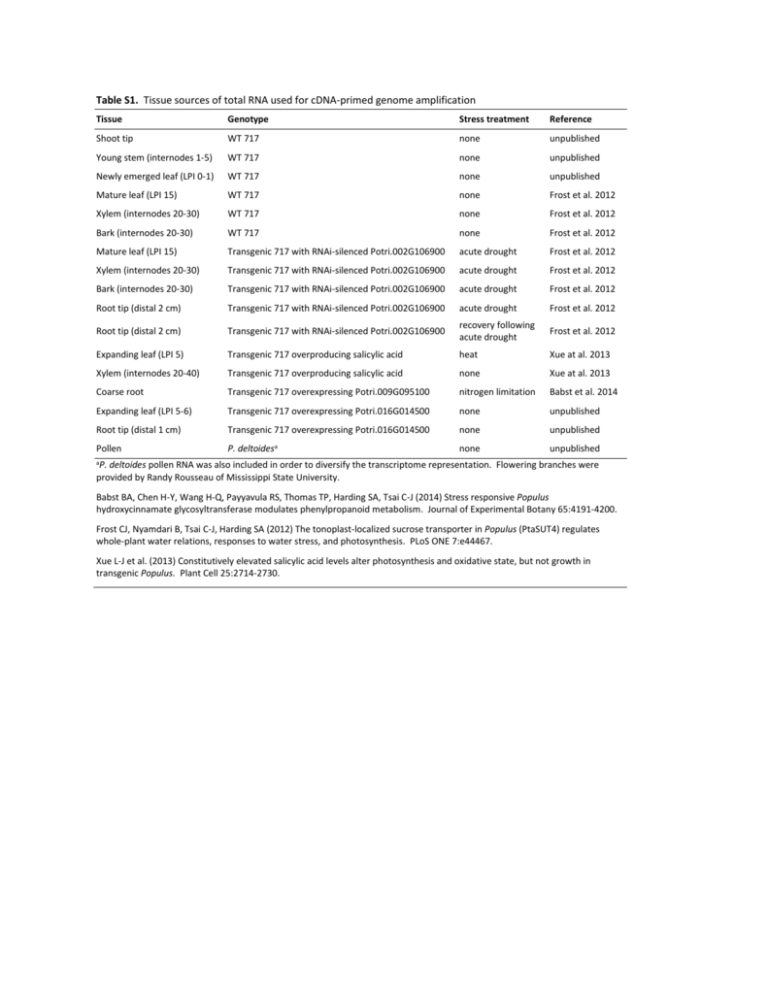
Table S1. Tissue sources of total RNA used for cDNA-primed genome amplification Tissue Genotype Stress treatment Reference Shoot tip WT 717 none unpublished Young stem (internodes 1-5) WT 717 none unpublished Newly emerged leaf (LPI 0-1) WT 717 none unpublished Mature leaf (LPI 15) WT 717 none Frost et al. 2012 Xylem (internodes 20-30) WT 717 none Frost et al. 2012 Bark (internodes 20-30) WT 717 none Frost et al. 2012 Mature leaf (LPI 15) Transgenic 717 with RNAi-silenced Potri.002G106900 acute drought Frost et al. 2012 Xylem (internodes 20-30) Transgenic 717 with RNAi-silenced Potri.002G106900 acute drought Frost et al. 2012 Bark (internodes 20-30) Transgenic 717 with RNAi-silenced Potri.002G106900 acute drought Frost et al. 2012 Root tip (distal 2 cm) Transgenic 717 with RNAi-silenced Potri.002G106900 acute drought Frost et al. 2012 Root tip (distal 2 cm) Transgenic 717 with RNAi-silenced Potri.002G106900 recovery following acute drought Frost et al. 2012 Expanding leaf (LPI 5) Transgenic 717 overproducing salicylic acid heat Xue at al. 2013 Xylem (internodes 20-40) Transgenic 717 overproducing salicylic acid none Xue at al. 2013 Coarse root Transgenic 717 overexpressing Potri.009G095100 nitrogen limitation Babst et al. 2014 Expanding leaf (LPI 5-6) Transgenic 717 overexpressing Potri.016G014500 none unpublished Root tip (distal 1 cm) Transgenic 717 overexpressing Potri.016G014500 none unpublished none unpublished Pollen P. deltoidesa a P. deltoides pollen RNA was also included in order to diversify the transcriptome representation. Flowering branches were provided by Randy Rousseau of Mississippi State University. Babst BA, Chen H-Y, Wang H-Q, Payyavula RS, Thomas TP, Harding SA, Tsai C-J (2014) Stress responsive Populus hydroxycinnamate glycosyltransferase modulates phenylpropanoid metabolism. Journal of Experimental Botany 65:4191-4200. Frost CJ, Nyamdari B, Tsai C-J, Harding SA (2012) The tonoplast-localized sucrose transporter in Populus (PtaSUT4) regulates whole-plant water relations, responses to water stress, and photosynthesis. PLoS ONE 7:e44467. Xue L-J et al. (2013) Constitutively elevated salicylic acid levels alter photosynthesis and oxidative state, but not growth in transgenic Populus. Plant Cell 25:2714-2730. Table S2. List of NGS datasets used in this study SRA accession Data type Name Sample code SRP049825 PE100 Populus tremula x Populus alba 717-1B4 genome sequencing All SRP042117 PE100 Xylem transcriptome response of transgenic Populus with altered tubulin expression All SRP041959 PE50 RNAseq analysis of SUT4-RNAi Populus All SRP059838 PE100 Populus defoliation experiment All SNP-calling Mapping performance evaluation SRP059838 PE100 Populus defoliation experiment SRX1071040, SRX1071050, SRX1071051 SRP041959 PE50 RNAseq analysis of SUT4-RNAi Populus SRX547993-SRX547998, SRX548011-SRX548016, SRX548029-SRX548034, SRX548047-SRX548052 SRP049825 PE100 Populus tremula x Populus alba 717-1B4 genome sequencing SRX759988 SRP028935a SE50 Transcriptional network study of Populus stem secondary growth SRX337461 a Liu L, Missirian V, Zinkgraf M, Groover A, Filkov V (2014) Evaluation of experimental design and computational parameter choices affecting analyses of ChIP-seq and RNA-seq data in undomesticated poplar trees. BMC Genomics 15:S3 Table S3. Identification of 717 genomic variants. Data source Program/variant-calling method DNA-Seq SHORE Variant no. Consensus 10,484,677 qVar 10,957,316 GATK UnifiedGenotyper 10,128,808 HaplotypeCaller 1,189,782 RNA-Seq Trinity & Samtools 1,319,112 NCBI mRNA Samtools 10,886 Table S4. Number of expressed genes detected using the two different genomes. Ptr_v3 sPta717_v1.1 Difference SE50 Leaf 22,213 22,770 557 Bark 22,783 23,408 625 Xylem 20,525 20,970 445 Leaf 22,435 22,906 471 Bark 22,995 23,542 547 Xylem 20,716 21,099 383 Leaf 21,303 22,179 876 Bark 21,936 22,910 974 Xylem 20,705 21,524 819 Leaf 21,538 22,383 845 Bark 22,234 23,027 793 Xylem 20,977 21,674 697 PE50 SE100 PE100 Genes with an FPKM ≥1 were considered expressed. Table S5. Mapping rates of DNA-Seq and ChIP-Seq reads. Genomic DNA Input ChIP-Seq Ptr_v3 sPta717 Ptr_v3 sPta717 Uniquely mapped 29.6% 39.5% 30.0% 40.4% Multiply mapped 24.3% 25.6% 22.6% 23.8% Unmapped 46.1% 34.8% 47.4% 35.8% SE50 data from SRA accession no. SRP028935 (Liu et al. 2014 BMC Genomics 15:S3). Table S6. Re-annotation of Affymetrix probe-sets using the sPta717 genome Grade Ptr_v3 sPta717 A 43,497 32,241 B 5,909 14,601 C 286 266 E 8,654 11,085 R 2,905 3,058 Control Total 162 162 61,413 61,413 Grades are defined according to Affymetrix. Grade A probe-sets had nine or more probes matching to the annotated transcript. All other grades had fewer than nine matching probes to the transcript, with B through R signifying decreasing level of evidence in support of the annotation.
