OSBS Assay using the Spectrophotometer
advertisement
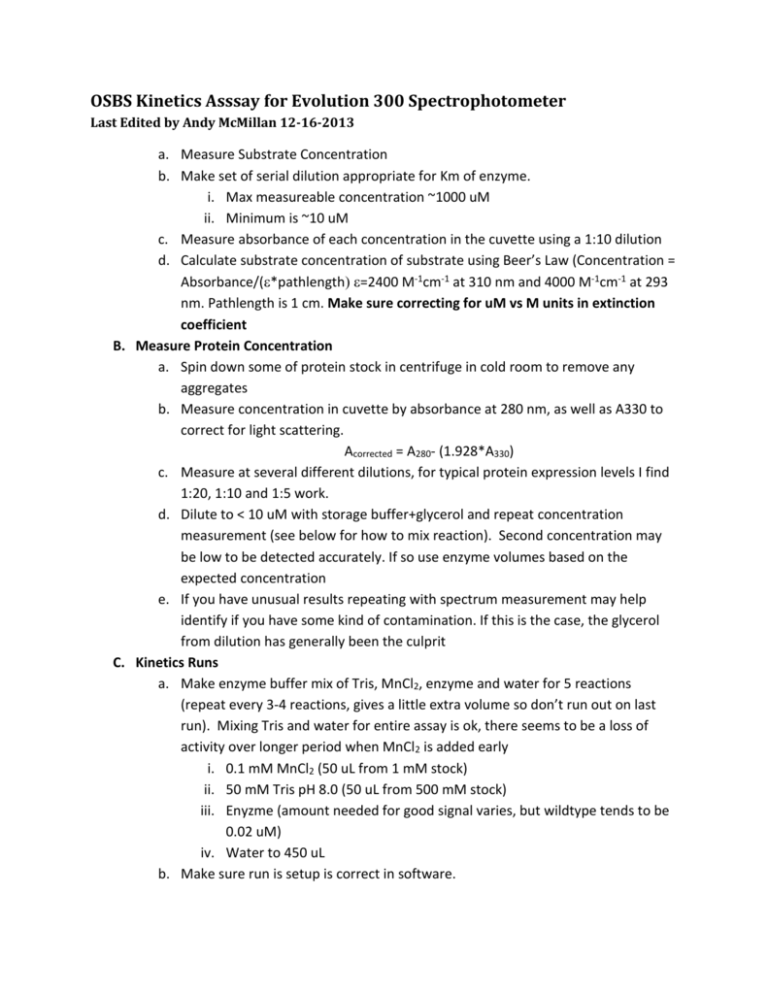
OSBS Kinetics Asssay for Evolution 300 Spectrophotometer Last Edited by Andy McMillan 12-16-2013 a. Measure Substrate Concentration b. Make set of serial dilution appropriate for Km of enzyme. i. Max measureable concentration ~1000 uM ii. Minimum is ~10 uM c. Measure absorbance of each concentration in the cuvette using a 1:10 dilution d. Calculate substrate concentration of substrate using Beer’s Law (Concentration = Absorbance/(*pathlength=2400 M-1cm-1 at 310 nm and 4000 M-1cm-1 at 293 nm. Pathlength is 1 cm. Make sure correcting for uM vs M units in extinction coefficient B. Measure Protein Concentration a. Spin down some of protein stock in centrifuge in cold room to remove any aggregates b. Measure concentration in cuvette by absorbance at 280 nm, as well as A330 to correct for light scattering. Acorrected = A280- (1.928*A330) c. Measure at several different dilutions, for typical protein expression levels I find 1:20, 1:10 and 1:5 work. d. Dilute to < 10 uM with storage buffer+glycerol and repeat concentration measurement (see below for how to mix reaction). Second concentration may be low to be detected accurately. If so use enzyme volumes based on the expected concentration e. If you have unusual results repeating with spectrum measurement may help identify if you have some kind of contamination. If this is the case, the glycerol from dilution has generally been the culprit C. Kinetics Runs a. Make enzyme buffer mix of Tris, MnCl2, enzyme and water for 5 reactions (repeat every 3-4 reactions, gives a little extra volume so don’t run out on last run). Mixing Tris and water for entire assay is ok, there seems to be a loss of activity over longer period when MnCl2 is added early i. 0.1 mM MnCl2 (50 uL from 1 mM stock) ii. 50 mM Tris pH 8.0 (50 uL from 500 mM stock) iii. Enyzme (amount needed for good signal varies, but wildtype tends to be 0.02 uM) iv. Water to 450 uL b. Make sure run is setup is correct in software. i. Usually read every 3s for 30 s. Adjust settings if needed for different proteins. ii. Read at 310 nm (293 would give more signal, but could be influenced by absorbance by Trp and Tyr in enzyme iii. Set to read many samples (100+). This will give plenty of extra so entire series is in a file, even if you need to repeat reactions. You can stop early, but if it reaches the end, additional points will end up in a new file. c. Blank sample, and running reaction with blank is good to have an estimate of the amount of noise and where zero change is. d. For each reaction: i. Add 10 uL of substrate to cuvette. ii. Start reaction with transferring 90 uL of enzyme mix to cuvette. iii. Mix ~6 times, but take care not to create bubbles. iv. Start recording with software e. SAVE DATA AS BATCH. Just saving table won’t include data for traces if you need to go back and refit away from the plate reader software D. Data Analysis a. Data can be fit in software. Difficult to describe here, but fairly straight forward if demonstrated. Resave batch after fitting, and export as text file. b. Fit data to from beginning of reaction to where rate begins to change i. Frequently there’s some lag at the beginning. If it’s just the first point or two, this may be ok to leave out of fitting, otherwise mixing more vigorously could be needed. c. Convert rate from AU/min to uM/s using C = Al =2400 and l = pathlength, Make sure properly converting software rate of AU/min to uM/s d. Get kobs by dividing by enzyme concentration e. Plot kobs vs substrate concentration in Kaleidograph i. Fit to Michelis-Menton equation (should be already defined) to determine kcat and Km ii. If not reaching saturation fit low concentrations to a linear plot for kcat/Km value E. Cleanup a. Wash cuvette, place in case and keep in drawer by spectrophotometer b. Empty tip container c. Take buffers and pipets back to your bench d. Return substrates and enzymes to refrigerator M-1cm-1
