chp35 - population ecology study guide
advertisement
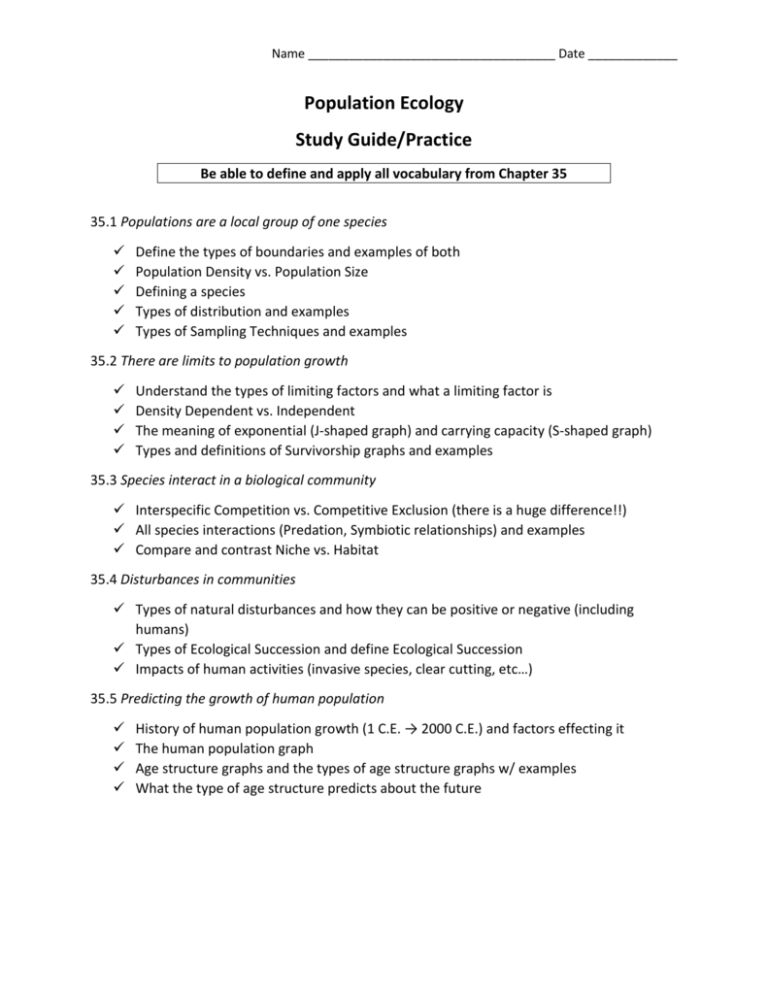
Name ____________________________________ Date _____________ Population Ecology Study Guide/Practice Be able to define and apply all vocabulary from Chapter 35 35.1 Populations are a local group of one species Define the types of boundaries and examples of both Population Density vs. Population Size Defining a species Types of distribution and examples Types of Sampling Techniques and examples 35.2 There are limits to population growth Understand the types of limiting factors and what a limiting factor is Density Dependent vs. Independent The meaning of exponential (J-shaped graph) and carrying capacity (S-shaped graph) Types and definitions of Survivorship graphs and examples 35.3 Species interact in a biological community Interspecific Competition vs. Competitive Exclusion (there is a huge difference!!) All species interactions (Predation, Symbiotic relationships) and examples Compare and contrast Niche vs. Habitat 35.4 Disturbances in communities Types of natural disturbances and how they can be positive or negative (including humans) Types of Ecological Succession and define Ecological Succession Impacts of human activities (invasive species, clear cutting, etc…) 35.5 Predicting the growth of human population History of human population growth (1 C.E. → 2000 C.E.) and factors effecting it The human population graph Age structure graphs and the types of age structure graphs w/ examples What the type of age structure predicts about the future Name ____________________________________ Date _____________ For each of the following write the term that best fits the description. ____________________ 1. J-shaped curve where a population is doubling ____________________ 2. S-shaped curve where a population is increasing but then levels off ____________________ 3. A condition that restricts the growth of a population ____________________ 4. Temperature and physical structures (like mountains) are examples of ____________________ 5. Graph that best represents survival of lizards and rodents over time ____________________ 6. Graph that compares the sharp increase or decrease of two populations ____________________ 7. Graph used to predict future needed resources for a country ____________________ 8. Type of curve made by human population growth from 0 to 2000 C.E. ____________________ 9. Food, habitat and disease are examples of these ____________________ 10. Interaction in which one organism consumes another ____________________ 11. Close interaction between organisms in which one species lives in or on the other ____________________ 12. Symbiotic relationship in which an organism obtains its food at the expense (harm) of the other organism ____________________ 13. Graph of the proportion of people in different age groups in a population ____________________ 14. Competition between species that depend on the same limited resource ____________________ 15. Living arrangement of an organism defined by its location, food sources, time of day, and other factors ____________________ 16. Relationship in which one organism benefits, while the other organism is neither harmed nor helped ____________________ 17. Relationship in which both organisms involved benefit
