Chapter 7 Homework 4
advertisement
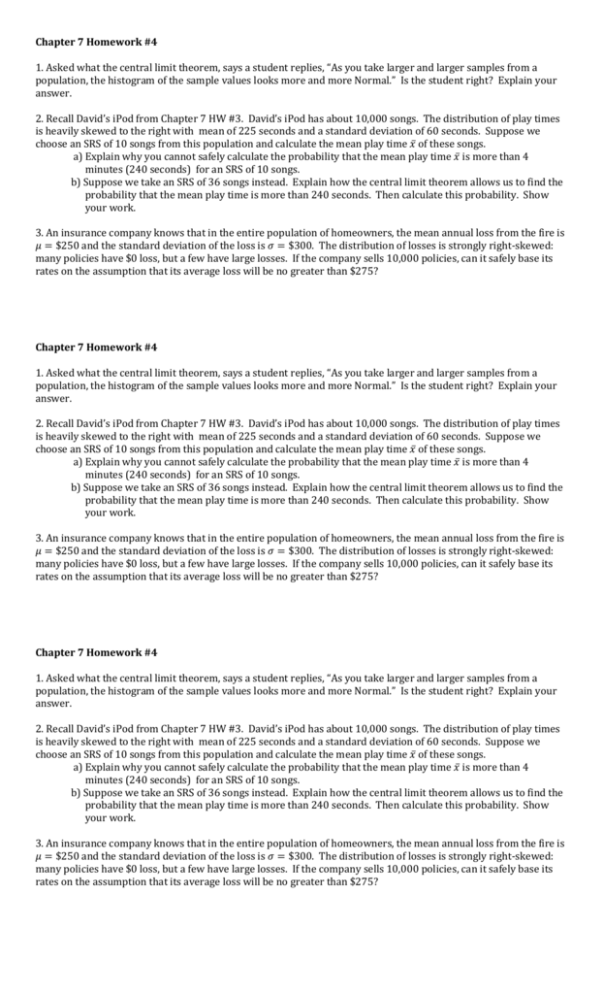
Chapter 7 Homework #4 1. Asked what the central limit theorem, says a student replies, “As you take larger and larger samples from a population, the histogram of the sample values looks more and more Normal.” Is the student right? Explain your answer. 2. Recall David’s iPod from Chapter 7 HW #3. David’s iPod has about 10,000 songs. The distribution of play times is heavily skewed to the right with mean of 225 seconds and a standard deviation of 60 seconds. Suppose we choose an SRS of 10 songs from this population and calculate the mean play time 𝑥̅ of these songs. a) Explain why you cannot safely calculate the probability that the mean play time 𝑥̅ is more than 4 minutes (240 seconds) for an SRS of 10 songs. b) Suppose we take an SRS of 36 songs instead. Explain how the central limit theorem allows us to find the probability that the mean play time is more than 240 seconds. Then calculate this probability. Show your work. 3. An insurance company knows that in the entire population of homeowners, the mean annual loss from the fire is 𝜇 = $250 and the standard deviation of the loss is 𝜎 = $300. The distribution of losses is strongly right-skewed: many policies have $0 loss, but a few have large losses. If the company sells 10,000 policies, can it safely base its rates on the assumption that its average loss will be no greater than $275? Chapter 7 Homework #4 1. Asked what the central limit theorem, says a student replies, “As you take larger and larger samples from a population, the histogram of the sample values looks more and more Normal.” Is the student right? Explain your answer. 2. Recall David’s iPod from Chapter 7 HW #3. David’s iPod has about 10,000 songs. The distribution of play times is heavily skewed to the right with mean of 225 seconds and a standard deviation of 60 seconds. Suppose we choose an SRS of 10 songs from this population and calculate the mean play time 𝑥̅ of these songs. a) Explain why you cannot safely calculate the probability that the mean play time 𝑥̅ is more than 4 minutes (240 seconds) for an SRS of 10 songs. b) Suppose we take an SRS of 36 songs instead. Explain how the central limit theorem allows us to find the probability that the mean play time is more than 240 seconds. Then calculate this probability. Show your work. 3. An insurance company knows that in the entire population of homeowners, the mean annual loss from the fire is 𝜇 = $250 and the standard deviation of the loss is 𝜎 = $300. The distribution of losses is strongly right-skewed: many policies have $0 loss, but a few have large losses. If the company sells 10,000 policies, can it safely base its rates on the assumption that its average loss will be no greater than $275? Chapter 7 Homework #4 1. Asked what the central limit theorem, says a student replies, “As you take larger and larger samples from a population, the histogram of the sample values looks more and more Normal.” Is the student right? Explain your answer. 2. Recall David’s iPod from Chapter 7 HW #3. David’s iPod has about 10,000 songs. The distribution of play times is heavily skewed to the right with mean of 225 seconds and a standard deviation of 60 seconds. Suppose we choose an SRS of 10 songs from this population and calculate the mean play time 𝑥̅ of these songs. a) Explain why you cannot safely calculate the probability that the mean play time 𝑥̅ is more than 4 minutes (240 seconds) for an SRS of 10 songs. b) Suppose we take an SRS of 36 songs instead. Explain how the central limit theorem allows us to find the probability that the mean play time is more than 240 seconds. Then calculate this probability. Show your work. 3. An insurance company knows that in the entire population of homeowners, the mean annual loss from the fire is 𝜇 = $250 and the standard deviation of the loss is 𝜎 = $300. The distribution of losses is strongly right-skewed: many policies have $0 loss, but a few have large losses. If the company sells 10,000 policies, can it safely base its rates on the assumption that its average loss will be no greater than $275?


