Analysis Help - BYU Sociology
advertisement
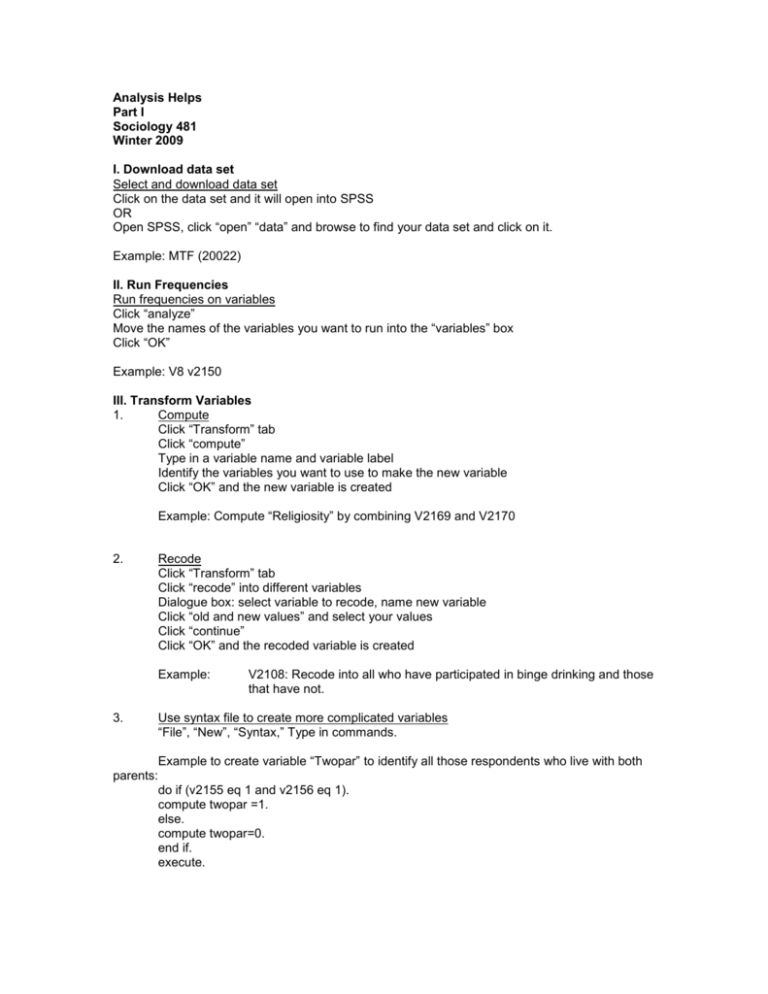
Analysis Helps Part I Sociology 481 Winter 2009 I. Download data set Select and download data set Click on the data set and it will open into SPSS OR Open SPSS, click “open” “data” and browse to find your data set and click on it. Example: MTF (20022) II. Run Frequencies Run frequencies on variables Click “analyze” Move the names of the variables you want to run into the “variables” box Click “OK” Example: V8 v2150 III. Transform Variables 1. Compute Click “Transform” tab Click “compute” Type in a variable name and variable label Identify the variables you want to use to make the new variable Click “OK” and the new variable is created Example: Compute “Religiosity” by combining V2169 and V2170 2. Recode Click “Transform” tab Click “recode” into different variables Dialogue box: select variable to recode, name new variable Click “old and new values” and select your values Click “continue” Click “OK” and the recoded variable is created Example: 3. V2108: Recode into all who have participated in binge drinking and those that have not. Use syntax file to create more complicated variables “File”, “New”, “Syntax,” Type in commands. Example to create variable “Twopar” to identify all those respondents who live with both parents: do if (v2155 eq 1 and v2156 eq 1). compute twopar =1. else. compute twopar=0. end if. execute. IV. Run Frequencies and/or Descriptives 1. Run frequencies on all categorical variables Click “analyze” Move the names of the variables you want to run into the “variables” box Click “OK” 2. Run descriptives on continuous variables Click “descriptive statistics” Click “frequencies” Move the names of the variables you want to run into the “variables” box Click “OK” 3. Define your missing data Look at the frequencies to determine if there are any values that you do not want in your analysis. Go to the SPSS data file, click on the “variable view” tab in the lower left of the screen. Click on the “missing” column. Click the variable you want to change and click the gray box. Select the values that you want to set as “missing” Click “OK” and then re-run your frequencies to make sure all of your values are in the specified range. V. Create a descriptive table that shows the name, range, mean, and SD of variables Table 1 Descriptive Statistics of Variables Minimum Maximum Mean SD Gender (1=female) 0 1 0.49 0.5 Live with both parents (0=no, 1=yes) 0 1 0.727 0.446 Binge Drinking (1=yes) 0.0 1 0.169 0.374 VI. Multivariate Analysis You need to choose an appropriate way to control for relevant confounding variables. This may be multiple level crosstabs, logistic regression, linear regression, partial correlation, or another appropriate procedure. 1. Multilevel Crosstabs Click “Analyze” Click “Descriptive Statistics” Click “Crosstabs” Move your independent variable into the “Columns” table Move your dependent variable into the “Rows” table Move your control variable into the “Layer 1 of 1” box Click “cells” and check “column” under percentages Click “Statistics” and an appropriate correlation Click OK 2. Linear Regression (For continuous dependent variables) Click “analyze” Click “regression” Click “linear” Place your dependent variable in the “dependent” box Place you independent variables in the “Independent(s)” box Click OK 3. Logistic Regression (For dichotomous dependent variables) Click “analyze” Click “regression” Click “binary logistic” Place your dependent variable in the “dependent” box Place you independent variables in the “covariates” box Click OK See consultants in 116 SWKT for computer and statistical help. In addition, I am available during my office hours and by appointment Percent Who Received Call Back by Race and Prison Record 40 34 35 30 Percent Called 25 Black White 20 17 14 15 10 5 5 0 Record No Record Prison Record


