Lab 8
advertisement
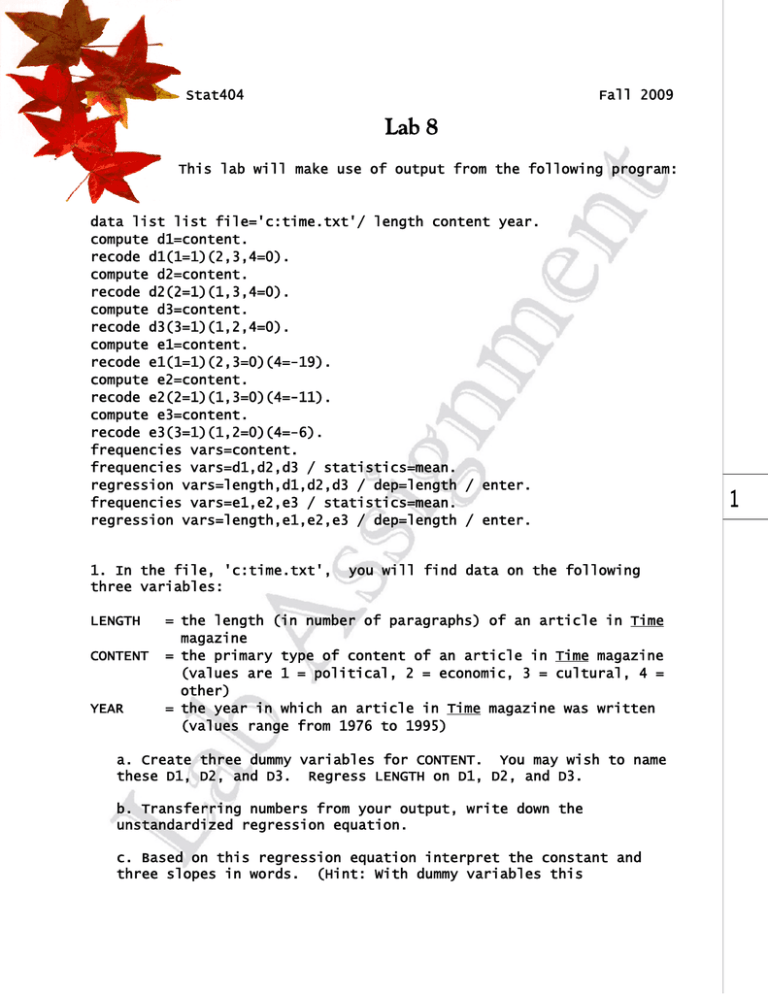
Stat404 Fall 2009 Lab 8 This lab will make use of output from the following program: data list list file='c:time.txt'/ length content year. compute d1=content. recode d1(1=1)(2,3,4=0). compute d2=content. recode d2(2=1)(1,3,4=0). compute d3=content. recode d3(3=1)(1,2,4=0). compute e1=content. recode e1(1=1)(2,3=0)(4=-19). compute e2=content. recode e2(2=1)(1,3=0)(4=-11). compute e3=content. recode e3(3=1)(1,2=0)(4=-6). frequencies vars=content. frequencies vars=d1,d2,d3 / statistics=mean. regression vars=length,d1,d2,d3 / dep=length / enter. frequencies vars=e1,e2,e3 / statistics=mean. regression vars=length,e1,e2,e3 / dep=length / enter. 1. In the file, 'c:time.txt', three variables: LENGTH CONTENT YEAR you will find data on the following = the length (in number of paragraphs) of an article in Time magazine = the primary type of content of an article in Time magazine (values are 1 = political, 2 = economic, 3 = cultural, 4 = other) = the year in which an article in Time magazine was written (values range from 1976 to 1995) a. Create three dummy variables for CONTENT. You may wish to name these D1, D2, and D3. Regress LENGTH on D1, D2, and D3. b. Transferring numbers from your output, write down the unstandardized regression equation. c. Based on this regression equation interpret the constant and three slopes in words. (Hint: With dummy variables this 1 interpretation should NOT make use of the "adjust" terminology that we have used thus far.) d. Verify that the dummy variables are NOT contrasts. 2. Reanalyze the data in 'c:time.txt' as follows: a. Create three weighted effect variables for CONTENT. You may wish to name these E1, E2, and E3. Regress LENGTH on E1, E2, and E3. b. Transferring numbers from your output, write down the unstandardized regression equation. c. Based on this regression equation interpret the constant and three slopes in words. (Hint: As with dummy variables you should NOT make use of "adjust" terminology in this interpretation.) d. Verify that the weighted effect variables ARE contrasts. e. In the program the constants -19, -11, and -6 are used in creating the effect variables. Show how these constants were calculated. f. On the computer output slopes for the effect variables represent the "effects" of three of the four types of article content. What is the effect of the fourth type of article content? Also demonstrate that the four effects sum to zero as indicated in equation 1. Below please find R and SAS code for these problems: # R # Code: time <- read.table("C:/time.txt") colnames(time) <- c("length","content","year") time$d1 <- 0 time$d2 <- 0 time$d3 <- 0 time$e1 <- 0 time$e2 <- 0 time$e3 <- 0 #Recode d1, d2, d3, e1, e2, and e3# time[time$content == 1, 4] <1 2 time[time$content == 2, 5] <1 time[time$content == 3, 6] <1 time[time$content == 1, 7] <1 time[time$content == 4, 7] <- -19 time[time$content == 2, 8] <1 time[time$content == 4, 8] <- -11 time[time$content == 3, 9] <1 time[time$content == 4, 9] <- -6 #Freqs and means# attach(time) table(content) table(d1) table(d2) table(d3) summary(time[,4:6]) table(e1) table(e2) table(e3) summary(time[,7:9]) #Regression# reg1 <- lm(length ~ d1+d2+d3, data=time) summary(reg1) reg2 <- lm(length ~ e1+e2+e3, data=time) summary(reg2) * SAS * Code; DATA time; INFILE 'C:\time.txt'; INPUT length content year; d1 = 0; d2 = 0; d3 = 0; e1 = 0; e2 = 0; e3 = 0; IF content = 1 THEN d1 = 1; IF content = 2 THEN d2 = 1; IF content = 3 THEN d3 = 1; IF content = 1 THEN e1 = 1; IF content = 4 THEN e1 = -19; 3 IF content = 2 THEN e2 = 1; IF content = 4 THEN e2 = -11; IF content = 3 THEN e3 = 1; IF content = 4 THEN e3 = -6; RUN; PROC FREQ; TABLES content d1 d2 d3 e1 e2 e3; RUN; PROC MEANS; VAR d1 d2 d3 e1 e2 e3; RUN; PROC REG; MODEL length = d1 d2 d3; RUN; PROC REG; MODEL length = e1 e2 e3; RUN; 4

