Week4 Exercise Answer sheet - SEC-130
advertisement
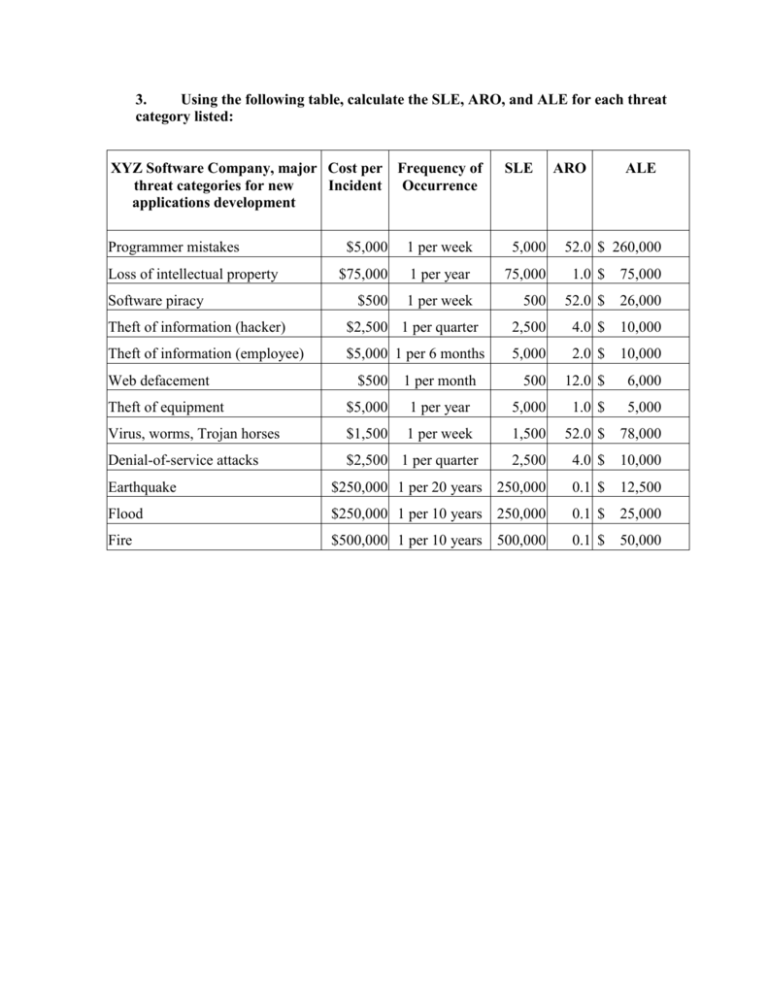
3. Using the following table, calculate the SLE, ARO, and ALE for each threat category listed: XYZ Software Company, major Cost per Frequency of threat categories for new Incident Occurrence applications development Programmer mistakes Loss of intellectual property Software piracy SLE ARO ALE $5,000 1 per week 5,000 52.0 $ 260,000 $75,000 1 per year 75,000 1.0 $ 75,000 $500 1 per week 500 52.0 $ 26,000 Theft of information (hacker) $2,500 1 per quarter 2,500 4.0 $ 10,000 Theft of information (employee) $5,000 1 per 6 months 5,000 2.0 $ 10,000 500 12.0 $ 6,000 Web defacement $500 1 per month Theft of equipment $5,000 1 per year 5,000 1.0 $ 5,000 Virus, worms, Trojan horses $1,500 1 per week 1,500 52.0 $ 78,000 Denial-of-service attacks $2,500 1 per quarter 2,500 4.0 $ 10,000 Earthquake $250,000 1 per 20 years 250,000 0.1 $ 12,500 Flood $250,000 1 per 10 years 250,000 0.1 $ 25,000 Fire $500,000 1 per 10 years 500,000 0.1 $ 50,000 4. How might XYZ Software Company arrive at the values in the above table? For each entry, describe the process of determining the cost per incident and frequency of occurrence a. It is most likely that the XYZ Software Company employed an economic feasibility study or cost benefit analysis to arrive at the values in their cost\incident table. b. For each of the entries in the chart, the cost per incident and the frequency of occurrence could have been reached through several, varied methods. Businesses often use benchmarking, best practices, and baselining to determine the values of cost per incident and frequency of occurrence. These techniques take in to account internal investigation and asset valuation, along with information that has been gathered by other sources in the industry, such as frequency of virus, worm, or Trojan attacks. All of these methods combined could provide the numbers for the costs and frequency for the chart listed. 5. Assume a year has passed and XYZ has improved security. Using the following table, calculate the SLE, ARO, and ALE for each threat category listed: SLE ARO ALE CBA Programmer mistakes 5,000 100% 60,000 180,000 Loss of intellectual property 75,000 50% 37,500 22,500 Software piracy 500 100% 6,000 -10,000 Theft of information (hacker) 2,500 100% 5,000 -10,000 Theft of information (employee) 5,000 100% 5,000 -10,000 Web defacement 500 100% 2,000 -14,000 Theft of equipment 5,000 50% 2,500 -12,500 Virus, worms, Trojan horses 1,500 100% 18,000 45,000 Denial-of-service attacks 2,500 100% 5,000 -12,500 Earthquake 250,000 5% 12,500 -5,000 Flood 50,000 10% 5,000 10,000 Fire 100,000 10% 10,000 30,000 Some of the values have changed due to the fact that controls were implemented and they had a positive impact on the protection of the assets of the organization thus reducing the frequency of occurrences. However, the controls did not reduce the cost of an incident to occur because the value of an asset will remain the same and cost the organization the same amount of time and money to replace. The controls put into place are worth the costs listed.
