VOLCANOES AND VOLCANIC ACTIVITY Geomorphology of
advertisement
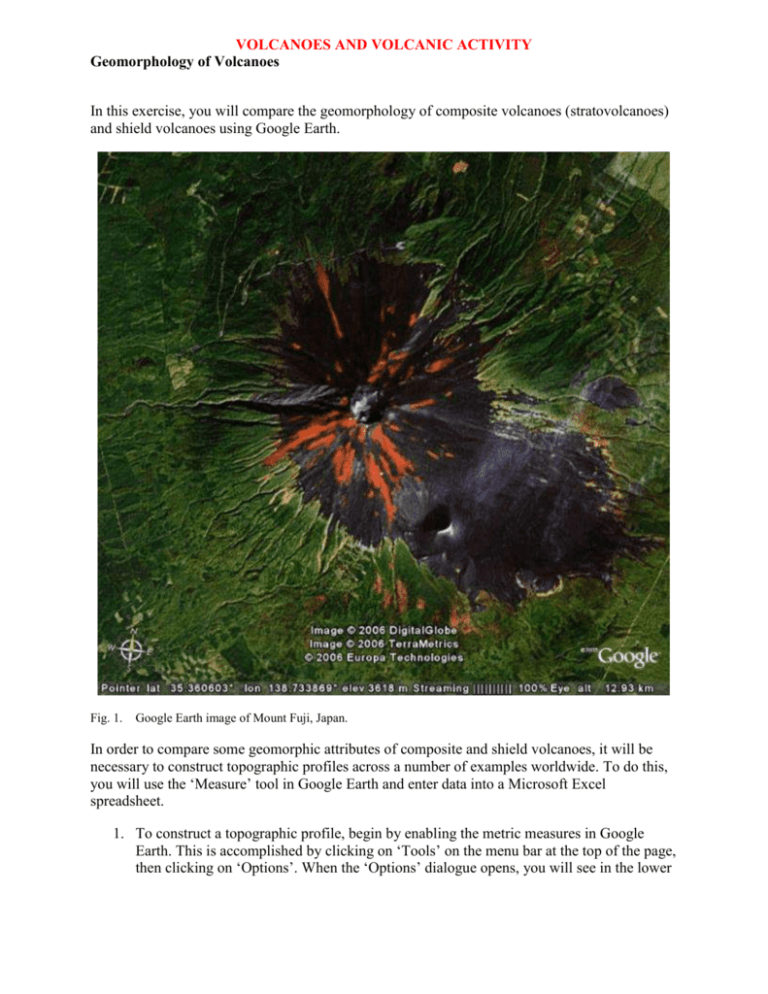
VOLCANOES AND VOLCANIC ACTIVITY Geomorphology of Volcanoes In this exercise, you will compare the geomorphology of composite volcanoes (stratovolcanoes) and shield volcanoes using Google Earth. Fig. 1. Google Earth image of Mount Fuji, Japan. In order to compare some geomorphic attributes of composite and shield volcanoes, it will be necessary to construct topographic profiles across a number of examples worldwide. To do this, you will use the ‘Measure’ tool in Google Earth and enter data into a Microsoft Excel spreadsheet. 1. To construct a topographic profile, begin by enabling the metric measures in Google Earth. This is accomplished by clicking on ‘Tools’ on the menu bar at the top of the page, then clicking on ‘Options’. When the ‘Options’ dialogue opens, you will see in the lower left of the dialogue an ‘Elevation’ option. Choose Meters, Kilometers, then ‘Apply Settings’. 2. Next, you should start up the Microsoft Excel program as you will be entering data generated from Google Earth into this spreadsheet. When the spreadsheet opens, label one column ‘Distance (m)’ and one column ‘Elevation (m)’. 3. Now, return to the Google Earth window and enable the ‘Measure’ tool by clicking on the word ‘Measure’ (or simultaneously using ‘ctrl + 6’ keys on your keyboard). When the ‘Measure’ dialogue box appears, use the drop down window to choose meters as the units of distance. Also select the tab labeled ‘Path’. 4. Note that the ‘Measure’ icon on your image appears as a box with tick marks along the mid-points. This box can be used to add points along your profile with approximately equal spacing; simply click the first point, then move the box until one of its tick marks is aligned with this point; now click again. The next point is located approximately the distance from the center of the box to a tick mark. This distance varies depending on the level to which you are zoomed into the image. In addition, from point to point, the distance is not precisely the same, but it is close enough for the exercises we are attempting to conduct. If you add a point and want to delete it, simply right click on your mouse and it will disappear. 5. You can determine the approximate spacing to each point by noting the cumulative distance along your profile and entering this distance at each point into the spreadsheet. 6. To begin your topographic profile, go to the first entry in the table below and enter the coordinates of the volcano in the Google Earth query bar. When Google Earth relocates to this position, zoom out until you can see the entire volcanic edifice. 7. Select a point along one edge of the volcanic edifice as your starting point and click on the ‘Measure’ tool. Note the distance reads ‘0.00’ meters. Type this value into the ‘Distance’ column of your spreadsheet. Note the elevation of this point by placing the ‘Measure’ cursor over it. A pointing finger icon will appear and you will be able to read the elevation (“elev”) of the point along the bottom of the image window to the right of the longitude. 8. Increment to your next point along your traverse by moving the ‘Measure’ cursor approximately by the half-width of the cursor box, then click again. This is your second profile point. When you click this point, note the distance along your profile (read from the ‘Measure’ dialogue box) and the elevation of the point (read along the bottom of the image to the right of the longitude). Enter the distance and the elevation into their respective columns in your spreadsheet. Repeat this process until you have completed a traverse across the volcanic edifice displayed on Google Earth. 9. To plot this topographic profile in Excel, choose the ‘Chart’ function from the ‘Insert’ menu at the top of the screen. 10. For ‘Chart Type’, choose, ‘XY (Scatter)’. Choose the scatter plot option ‘Scatter with data points connected by lines’. Make the ‘DISTANCE’ column the X-axis and ‘ELEVATION’ column the Y-Axis of your plot. 11. To add a second topographic profile to the first from the ‘Chart’ dialogue box, click on the ‘Series’ tab at the top of the box. In the ‘Series’ box in the lower left corner, click on the ‘Add’ button. Type ‘Mount Fuji’ in the ‘Name’ box to the right, then for ‘X values’ add the data from the ‘DISTANCE’ column from Mt. Fuji; ‘Y values’ will be the ‘ELEVATION’ data from Mt. Fuji. Mauna Kea DIST (m) ELEV (m) 0 994 1778.66 1095 3671.09 1234 5450.44 1387 7318.48 1523 9200.09 1733 10957.04 1906 12713.07 2121 14474.97 2426 16213.23 2708 18930.71 2972 20632.98 3247 21311.45 3456 22974.38 3626 24726.15 3896 26460.38 4025 28099.71 3874 29753.04 3654 31523.05 3377 33183.97 3097 34866.75 2772 36568.32 2465 38280.48 2258 40004.78 2034 41732.84 1867 43574.11 1690 45320.51 1538 47073.87 1396 48832.48 1267 50599.34 1139 53373.37 1015 54188.03 892 56049.62 764 57859.27 618 59669.37 491 61497.33 347 Fuji DIST (m) ELEV (m) 0 896 603.98 962 1207.78 1033 1811.43 1112 2414.16 1202 3023.2 1322 3651.22 1425 4236.8 1520 4824.15 1639 5453.65 1823 6062.65 2102 6685.37 2382 7270.37 2724 7831.75 3051 8404.84 3404 8917.6 3653 9401.48 3648 9881.71 3451 10375.16 3166 10885.23 2907 11410.46 2661 11947.53 2448 12530.11 2227 13120.11 2048 13718.98 1883 14291.64 1741 14905.95 1596 15492.29 1468 16077.28 1369 16670.43 1264 17258.23 1190 17885.13 1113 18517.42 1035 19149.85 970 19748.77 912 20344.62 866 4500 TOPOGRAPHIC PROFILES 4000 Mauna Kea Mount Fuji 3500 ELEVATION (m) 3000 2500 2000 1500 1000 500 0 0 10000 20000 30000 40000 50000 60000 70000 DISTANCE (m) 12. Describe what you observe on the resulting topographic profile for these volcanoes. Both volcanoes are similar heights, though Mauna Kea is much broader, implying more gentle slopes. 13. Note that both profiles are nearly triangular above 1000 m elevation. Given that each volcano is nearly circular, each is actually cone-shaped. Use the Internet to locate the formula for the volume of a cone. 14. Once you have located the formula for the volume of a cone, calculate the volumes of Mauna Kea and Mt. Fuji above from the 1,000 m elevation to each volcano’s summit. How do these volcanoes compare? Mauna Kea = ca. 2.82 x 10¹² m3; Fuji = 3.07 x 10¹¹m3; the volume of Mauna Kea is approximately 1 order of magnitude (10 times) greater than Mt. Fuji. 15. OPTIONAL: Read the Wikipedia article on Mauna Kea. Note that the volcano rises over 5,000 m from the floor of the Pacific Ocean. Assuming the volcano maintains its coneshaped form to the seafloor, recalculate its volume from the seafloor base to the summit. 5.60 x 10¹³m3 Table 1. Location of shield volcano and composite volcano for this exercise. NAME LATITUDE LONGITUDE Mauna Kea, Hawai’i 19.815332 -155.472645 Mount Fuji, Japan 35.366673 138.733347 LINKS TO RELATED SITES: Wikipedia entry on shield volcanoes: http://en.wikipedia.org/wiki/Shield_volcano Wikipedia entry on composite volcanoes: http://en.wikipedia.org/wiki/Composite_volcano Wikipedia entry on Mauna Kea: http://en.wikipedia.org/wiki/Mauna_Kea Wikipedia entry on Mt. Fuji: http://en.wikipedia.org/wiki/Mount_Fuji
