Experiment 9
advertisement
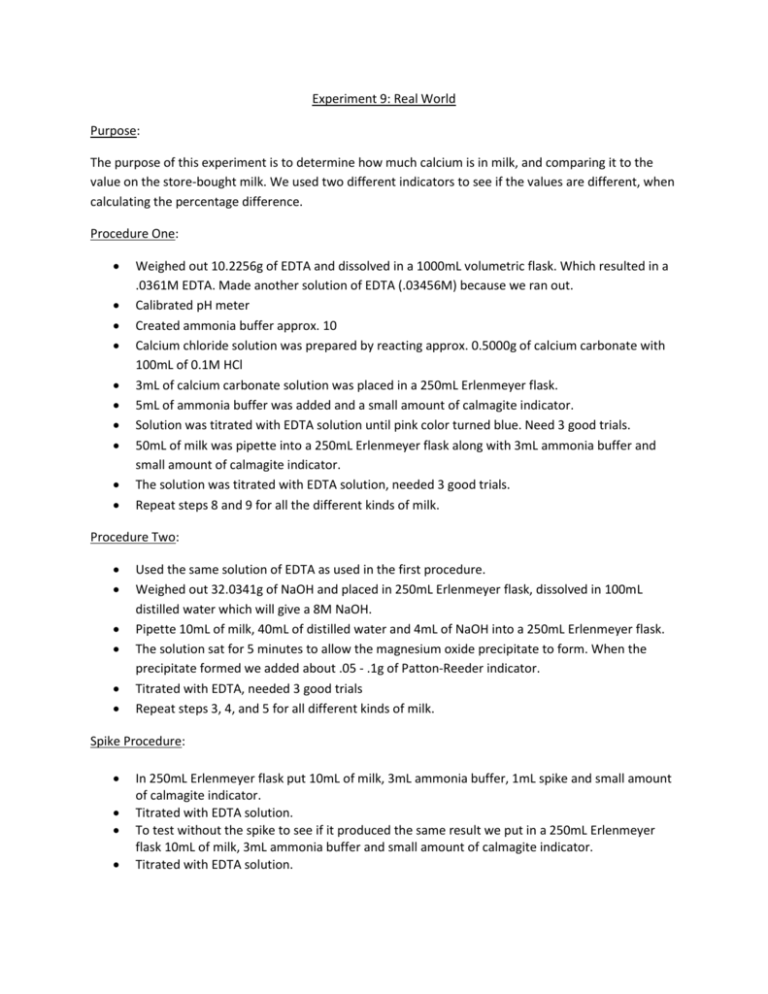
Experiment 9: Real World Purpose: The purpose of this experiment is to determine how much calcium is in milk, and comparing it to the value on the store-bought milk. We used two different indicators to see if the values are different, when calculating the percentage difference. Procedure One: Weighed out 10.2256g of EDTA and dissolved in a 1000mL volumetric flask. Which resulted in a .0361M EDTA. Made another solution of EDTA (.03456M) because we ran out. Calibrated pH meter Created ammonia buffer approx. 10 Calcium chloride solution was prepared by reacting approx. 0.5000g of calcium carbonate with 100mL of 0.1M HCl 3mL of calcium carbonate solution was placed in a 250mL Erlenmeyer flask. 5mL of ammonia buffer was added and a small amount of calmagite indicator. Solution was titrated with EDTA solution until pink color turned blue. Need 3 good trials. 50mL of milk was pipette into a 250mL Erlenmeyer flask along with 3mL ammonia buffer and small amount of calmagite indicator. The solution was titrated with EDTA solution, needed 3 good trials. Repeat steps 8 and 9 for all the different kinds of milk. Procedure Two: Used the same solution of EDTA as used in the first procedure. Weighed out 32.0341g of NaOH and placed in 250mL Erlenmeyer flask, dissolved in 100mL distilled water which will give a 8M NaOH. Pipette 10mL of milk, 40mL of distilled water and 4mL of NaOH into a 250mL Erlenmeyer flask. The solution sat for 5 minutes to allow the magnesium oxide precipitate to form. When the precipitate formed we added about .05 - .1g of Patton-Reeder indicator. Titrated with EDTA, needed 3 good trials Repeat steps 3, 4, and 5 for all different kinds of milk. Spike Procedure: In 250mL Erlenmeyer flask put 10mL of milk, 3mL ammonia buffer, 1mL spike and small amount of calmagite indicator. Titrated with EDTA solution. To test without the spike to see if it produced the same result we put in a 250mL Erlenmeyer flask 10mL of milk, 3mL ammonia buffer and small amount of calmagite indicator. Titrated with EDTA solution. Data: Mass EDTA: 10.2256g, 11.0996g Mass NaOH: 32.0341g Molarity of EDTA Trials 1 2 3 EDTA added (mL) 4.5 4.0 4.0 Molarity of EDTA 0.0333 0.0375 0.0375 Avg: 0.0361 2nd Molarity of EDTA Trials 1 2 3 EDTA added (mL) 4.6 4.1 4.3 Molarity of EDTA 0.03248 0.03645 0.03475 Avg: 0.03456 1% milk (60% Calcium) Calmagite Indicator Trials 1 2 3 EDTA added (mL) 77.1 73.2 81.7 Grams of Ca2+ .11155 .10591 .11820 Avg: .11189 Patton-Reeder Trials 1 2 3 EDTA added (mL) 16.6 12.4 13.2 Grams of Ca2+ .02402 .01794 .01910 Avg: .02035 Nonfat skim milk (25% Calcium) Calmagite Indicator Trials 1 2 3 EDTA added (mL) 80.0 79.8 81.2 Grams of Ca2+ .11575 .11546 .11748 Avg: .11623 Patton-Reeder Trials 1 2 3 EDTA added (mL) 12.6 13.8 12.7 Grams of Ca2+ .01823 .01997 .01837 Avg: .01886 Lactose milk (50% Calcium) Calmagite Indicator Trials 1 2 3 EDTA added (mL) 76.3 75.9 78.1 Grams of Ca2+ .10568 .10513 .10818 Avg: .10633 Patton-Reeder Trials 1 2 3 EDTA added (mL) 8.9 9.0 8.5 Grams of Ca2+ .01233 .01247 .01177 Avg: .01219 mL EDTA (spike) 13.6 14.3 13.9 mL EDTA (w/o spike) 12.3 12.6 12.3 2% milk (30% Calcium) Calmagite Indicator Trials 1 2 3 EDTA added (mL) 66.3 73.1 64.6 Grams of Ca2+ .09183 .10125 .08948 Avg: .09419 Patton-Reeder Trials 1 2 3 EDTA added (mL) 11.4 11.2 10.1 Grams of Ca2+ .01579 .01551 .01399 Avg: .01510 mL EDTA (spike) 14.0 13.4 13.4 mL EDTA (w/o spike) 12.0 12.1 12.2 EDTA added (mL) 16.8 15.2 13.1 Grams of Ca2+ .02327 .02105 .01814 Avg: .02082 Spike Trials 1 2 3 Spike Trials 1 2 3 Soy milk (45% Calcium) Calmagite Indicator Trials 1 2 3 Patton-Reeder Trials 1 2 3 EDTA added (mL) 19.3 13.3 16.5 Grams of Ca2+ .02673 .01842 .02285 Avg: .02267 mL EDTA (spike) 18.4 18.8 18.05 mL EDTA (w/o spike) 17.3 17.9 17.1 Spike Trials 1 2 3 Calculations: Molarity of EDTA 𝐿 𝐶𝑎𝐶𝑂3 × 𝑔 𝐶𝑎𝐶𝑂3 ÷ 𝑚𝑜𝑙𝑎𝑟 𝑚𝑎𝑠𝑠𝐶𝑎𝐶𝑂3 × 0.003𝐿 𝐶𝑎𝐶𝑂3 × 0.5𝑔 𝐶𝑎𝐶𝑂3 × 1 1 × 0.1𝐿 𝐿 𝐸𝐷𝑇𝐴 𝑎𝑑𝑑𝑒𝑑 𝑚𝑜𝑙 1 1 × × = 0.0333𝑀 𝐸𝐷𝑇𝐴 100.09𝑔 𝐶𝑎𝐶𝑂3 0.1𝐿 0.0045𝐿 𝐸𝐷𝑇𝐴 Ex: 1% milk w/calmagite indicator Ca2+ concentration in milk 𝐿 𝐸𝐷𝑇𝐴 𝑎𝑑𝑑𝑒𝑑 × 𝑀 𝐸𝐷𝑇𝐴 × 1𝑚𝑜𝑙 𝐶𝑎2+ × 𝑚𝑜𝑙𝑎𝑟 𝑚𝑎𝑠𝑠 𝐶𝑎2+ 1𝑚𝑜𝑙 𝐸𝐷𝑇𝐴 . 0771 𝐿 𝐸𝐷𝑇𝐴 × .0361 𝑀 𝐸𝐷𝑇𝐴 × 1𝑚𝑜𝑙 𝐶𝑎2+ 40.078𝑔 𝐶𝑎2+ × = .11155𝑔 1𝑚𝑜𝑙 𝐸𝐷𝑇𝐴 𝑚𝑜𝑙 Grams of Calcium per serving 𝑔𝑟𝑎𝑚𝑠 𝐶𝑎2+ 𝑣𝑜𝑙 × 𝑣𝑜𝑙 𝑜𝑓 𝑠𝑎𝑚𝑝𝑙𝑒 𝑠𝑒𝑟𝑣𝑖𝑛𝑔 . 11155 𝑔 𝐶𝑎2+ 240𝑚𝐿 . 53544𝑔 𝐶𝑎2+ × = 50𝑚𝐿 𝑠𝑒𝑟𝑣𝑖𝑛𝑔 𝑠𝑒𝑟𝑣𝑖𝑛𝑔 Grams of Calcium per serving based on 2,000 Calorie Diet 𝑚𝑔 𝑐𝑎𝑙𝑐𝑖𝑢𝑚(𝑟𝑒𝑐𝑜𝑚𝑚𝑒𝑛𝑑𝑒𝑑 𝑑𝑎𝑖𝑙𝑦) × 1100𝑚𝑔 × 1𝑔 × 𝑝𝑒𝑟𝑐𝑒𝑛𝑡𝑎𝑔𝑒 𝐶𝑎2+ 𝑖𝑛 𝑡ℎ𝑒 𝑚𝑖𝑙𝑘 1000𝑚𝑔 1𝑔 = 1.1𝑔 × 60% = .66𝑔 𝑐𝑎𝑙𝑐𝑖𝑢𝑚 1000𝑚𝑔 Percent Difference |𝐴𝑐𝑡𝑢𝑎𝑙 − 𝐸𝑥𝑝𝑒𝑟𝑖𝑚𝑒𝑛𝑡𝑎𝑙| × 100% 𝐴𝑐𝑡𝑢𝑎𝑙 |. 66 − .53544| × 100% = 18.9% . 66 Conclusion: The purpose of this experiment was to determine how much calcium was present in different types of milk. We used two different types of indicators to see if they produce different results. Overall I think the Patton-Reeder indicator produced the best results, but the calmagite produced the lowest percent difference of 7.68% as well as the highest percent difference of 102%. I think the results all depended on what type of milk was being used for the experiment. There were several errors that could have occurred when doing this experiment. One error is we might not have titrated enough; it would turn a blue color than turn back to purple after a minute. Another source of error is not letting the magnesium oxide precipitate form, which reacts with the Patton-Reeder indicator.
