File
advertisement
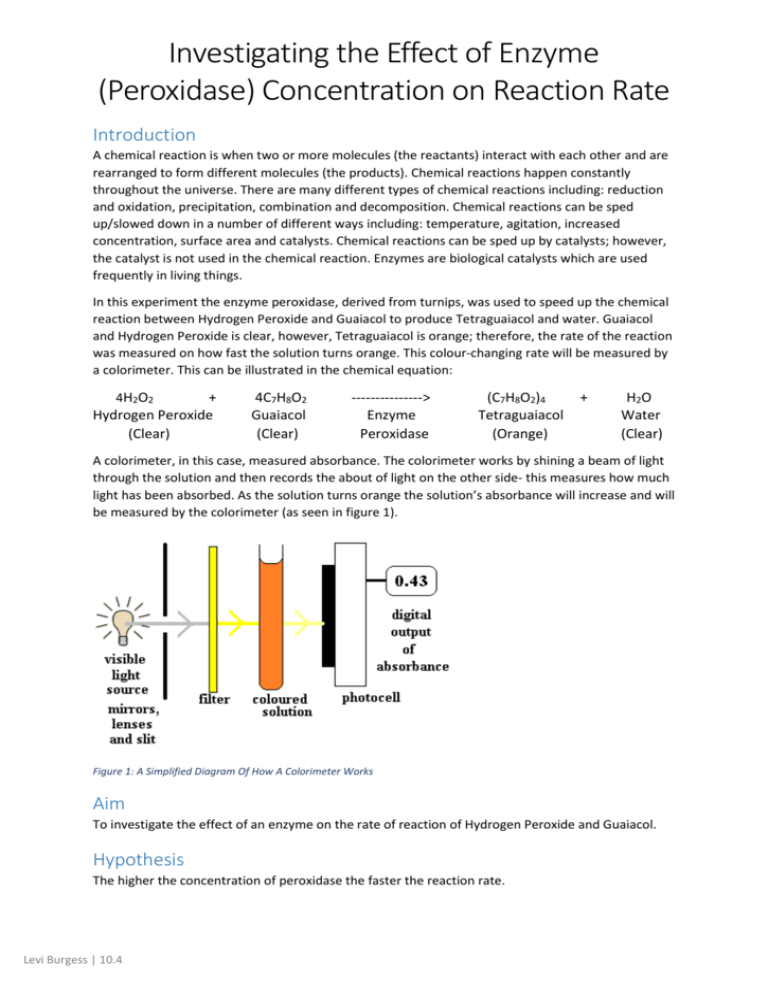
Investigating the Effect of Enzyme (Peroxidase) Concentration on Reaction Rate Introduction A chemical reaction is when two or more molecules (the reactants) interact with each other and are rearranged to form different molecules (the products). Chemical reactions happen constantly throughout the universe. There are many different types of chemical reactions including: reduction and oxidation, precipitation, combination and decomposition. Chemical reactions can be sped up/slowed down in a number of different ways including: temperature, agitation, increased concentration, surface area and catalysts. Chemical reactions can be sped up by catalysts; however, the catalyst is not used in the chemical reaction. Enzymes are biological catalysts which are used frequently in living things. In this experiment the enzyme peroxidase, derived from turnips, was used to speed up the chemical reaction between Hydrogen Peroxide and Guaiacol to produce Tetraguaiacol and water. Guaiacol and Hydrogen Peroxide is clear, however, Tetraguaiacol is orange; therefore, the rate of the reaction was measured on how fast the solution turns orange. This colour-changing rate will be measured by a colorimeter. This can be illustrated in the chemical equation: 4H2O2 + Hydrogen Peroxide (Clear) 4C7H8O2 Guaiacol (Clear) ---------------> Enzyme Peroxidase (C7H8O2)4 Tetraguaiacol (Orange) + H2O Water (Clear) A colorimeter, in this case, measured absorbance. The colorimeter works by shining a beam of light through the solution and then records the about of light on the other side- this measures how much light has been absorbed. As the solution turns orange the solution’s absorbance will increase and will be measured by the colorimeter (as seen in figure 1). Figure 1: A Simplified Diagram Of How A Colorimeter Works Aim To investigate the effect of an enzyme on the rate of reaction of Hydrogen Peroxide and Guaiacol. Hypothesis The higher the concentration of peroxidase the faster the reaction rate. Levi Burgess | 10.4 Variables Independent Enzyme (Peroxidase) Concentration (mL) Dependent Absorbance Constants Amount of pH 5 Buffer- 1mL in each reaction Amount of Hydrogen Peroxide (H2O2)- 0.5mL in each reaction Amount of Guaiacol (C7H8O2)- 0.25mL in each reaction Temperature (20oC) Materials A sample of pH 5 Buffer A sample of Dilute Hydrogen Peroxide A sample of Dilute Guaiacol A sample of pH 7 Phosphate Extraction Buffer A sample of Peroxidase (enzyme) Colorimeter 18 Cuvettes (3 for each concentration) Stopwatch Electronic Pipette (Which can measure to 0.000 of a millilitre) 5 Pipette nozzles (one for each chemical) Normal Pipette Tissues Method 1. Turn on colorimeter, adjust wavelength setting to 500 nm, and allow instrument to warm up for 15-20 minutes. 2. Prepare two cuvettes for each Reaction: one containing reactants (Cuvette R) and the other containing the enzyme (Cuvette E) a. Table 1: Reaction 1: Cuvette R Cuvette E 0.5 mL pH 5 buffer 0.5 mL pH 5 buffer 0.5 mL Dilute Hydrogen Peroxide 1.125 mL pH 7 Phosphate Extraction Buffer 0.25 mL Dilute Guaiacol 0.125 mL Peroxidase b. Table 2: Reaction 2: Cuvette R Cuvette E 0.5 mL pH 5 buffer 0.5 mL pH 5 buffer 0.5 mL Dilute Hydrogen Peroxide 1.025 mL pH 7 Phosphate Extraction Buffer 0.25 mL Dilute Guaiacol 0.225 mL Peroxidase c. Table 3: Reaction 3: Cuvette R 0.5 mL pH 5 buffer 0.5 mL Dilute Hydrogen Peroxide 0.25 mL Dilute Guaiacol Cuvette E 0.5 mL pH 5 buffer 0.925 mL pH 7 Phosphate Extraction Buffer 0.325 mL Peroxidase 3. Prepare the control cuvette by combining: 1mL pH 5 buffer, 0.5 mL Dilute Hydrogen Peroxide, 0.25mL Dilute Guaiacol and 1.25mL pH 7 Phosphate Extraction Buffer. Levi Burgess | 10.4 4. Zero the colorimeter (zero absorbance) at 500 nm using the control solution 5. When ready to begin, carefully pour contents of reaction 1’s cuvette R into cuvette E, stir with pipette and wipe clear side of cuvette with a tissue. Then place it into the colorimeter and immediately start timing. 6. Measure and record the absorbance as a function of time every 30 seconds for 5 minutes. 7. Repeat step 5-6 for each reaction. 8. Plot the results on a graph (Absorbance v Time, reaction rate is slope of the line) Figure 2: Experimental Setup Figure 3: Combining The Cuvettes Safety A few of the chemicals used are minor irritants. Dilute Guaiacol is slightly toxic and is harmful if inhaled and could cause skin irritation if it comes in contact with exposed skin; therefore, it would be prudent to replace the lid on the Guaiacol when it is not being used and to wear a lab coat, glasses and gloves to protect eyes and skin. Hydrogen peroxide is an oxidiser and bleach so it can also cause Levi Burgess | 10.4 skin irritation and is harmful if swallowed or breathed in, so follow above precautions. There is also glassware used in this experiment so be careful not to break it and keep it away from the edge of the work bench. Results Table 4: Light Absorbance in relation to amount of Peroxidase over 5 minutes Time (sec) Concentration 1 Concentration 2 Concentration 3 (0.125mL) (0.225mL) (0.325mL) 0.261 0.279 0.323 0.355 0.392 0.428 0.461 0.493 0.524 0.552 0.581 0.054 0.098 0.153 0.208 0.245 0.305 0.347 0.393 0.425 0.461 0.496 0.800 0.855 0.920 0.950 1.080 1.090 1.189 1.210 1.267 1.287 1.288 0 30 60 90 120 150 180 210 240 270 300 Graph 1: Reaction Speed of Hydrogen Peroxide and Guaiacol with varying amounts of Peroxidase 1.6 1.4 y = 0.0018x + 0.8197 Absorbance 1.2 1 0.8 y = 0.0011x + 0.2572 0.6 0.4 y = 0.0015x + 0.0645 0.2 0 0 50 100 150 200 250 300 350 Time (Seconds) Concentration 1 (0.125mL) Concentration 2 (0.225mL) Concentration 3 (0.325mL) Blank Discussion The results show that the amount of peroxidase does change the reaction rate. The hypothesis that ‘the higher the concentration of peroxidase the faster the reaction rate’ is supported by the results (see Graph 1). It is evident (as seen in graph 1) that the higher the concentration of Peroxidase, the higher the absorbance became in a far shorter period of time; therefore, the reaction occurred Levi Burgess | 10.4 quicker- supporting the hypothesis. This is especially evident in Reaction 3’s steep linear trend line compared to the other concentrations; as Reaction 3 had the most enzyme in it (0.325mL compared to 0.225mL and 0.125mL), it reacted the quickest. The control, which had no enzyme in it, did not react at all (see graph 1), showing that the presence of an enzyme is required for the reaction to occur at any significant speed. If a solution contains a higher concentration of enzymes, then the reaction rate will increase because there are more enzymes to break down the substrate (substance on which an enzyme acts). Therefore, the more enzymes present the quicker the substrate will be broken down and in turn, the quicker the reaction- as supported by the results. More enzymes also means that more collisions with reactants will occur per unit of time, hence, a faster conversion of reactants to products. However, one would assume if this experiment continued on long enough the reaction rate will eventually plateau as the enzyme molecules become saturated (when all the molecules of enzymes are working at full capacity); however, the more enzyme molecules the longer it will take for them to become saturated, therefore, the quicker the reaction. The reaction rate will also plateau when all the Hydrogen Peroxide and Guaiacol molecules become Tetraguaiacol and water molecules, as illustrated in the chemical equation: 4C7H8O2 + 4H2O2 C28H24O8 + H2O The effectiveness of enzymes are affected by temperature and pH, which is why a pH buffer was used to keep the solution at the optimum pH, and the temperature was room temperature; this isolated the effect of the enzyme purely to its concentration- the independent variable (Chemistry for Biologists, 2014). A random error is one made by human limitations and potentially affects each test differently. One potential random that was not mixing the solution properly before putting it into the colorimeter. If the solution was not mixed enough it: would affect the absorbance as the colorimeter is very precise and would take longer for the reaction to take place, since the enzyme would not have been thoroughly mixed with the other reactants. More trials could be conducted to reduce the effects of this random error. Another potential random was the fact that the time varied between mixing Tube R and Tube E before placing it in the colorimeter in each trial. The reaction began as soon as the cuvettes were mixed so waiting different periods of time between measuring the absorbance would have given different readings. This may explain the excessively high trend line for Concentration 3 (see graph 1) since this reaction would have happened quicker than the other two, as there was more enzyme, so the wait would have had a larger effect. This may also explain why Concentration 1’s trend line is higher than Concentration 2’s (see graph 1), since the wait may have been longer for concentration 1 so the results are higher. However, the rate of reaction is based measured of the gradient of the line and Concentration 2’s line is steeper so the rate of reaction was quicker- supporting the hypothesis. One way to reduce the effect of this random error would be to have a set period of time between mixing the solutions and taking the first reading. More trials would minimise the effects of these random errors. A systematic error is an error caused by imperfections in the equipment used, systematic errors unlike random errors affect all the trials equally. One potential systematic error was the colorimeter not being calibrated properly. This would affect all the results by a certain amount. When the results are graphed the systematic error would affect the vertical translation of the results graphed, however, not the slope of the lines, therefore not the rate of the reaction. This systematic error could be identified by repeating the experiment with different equipment and then comparing the results. Only one trial of each concentration was recorded, therefore, any random errors would have had a large impact on the results, and would have been difficult to identify. Therefore, one major improvement to the method would be to do each concentration at least three times so that the results can be averaged, in turn reducing the effect of the random errors. Another improvement Levi Burgess | 10.4 would be to have a set time limit between mixing the solutions and taking the first reading, this would help keep the results consistent and, therefore, precise. Conclusion The aim of this experiment was to investigate the how the concentration of the enzyme (peroxidase) affects the reaction rate. The hypothesis was that the higher the concentration of peroxidase the faster the reaction rate. By using a colorimeter, stop watch, Hydrogen Peroxide, Guaiacol, pH 5 Buffer, pH 7 Phosphate Extraction Buffer and varying concentrations of the Peroxidase enzyme, the results showed that the enzyme concentration does affect the reaction rate, and that the stated hypothesis was supported. The reaction rate increased and decreased with the concentration of Peroxidase; the higher the concentration the more enzymes present in the solution, the more enzymes present the faster the reactants are rearranged, the faster the reactants are rearranged the quicker the reaction rate. The experiment and its results would be more reliable if further trials were undertaken. Bibliography Levi Burgess | 10.4 Chemistry for Biologists, (2014). Enzymes. [online] Available at: http://www.rsc.org/Education/Teachers/Resources/cfb/enzymes.htm [Accessed 10 Sep. 2014].
