Peroxidase Kinetics
advertisement
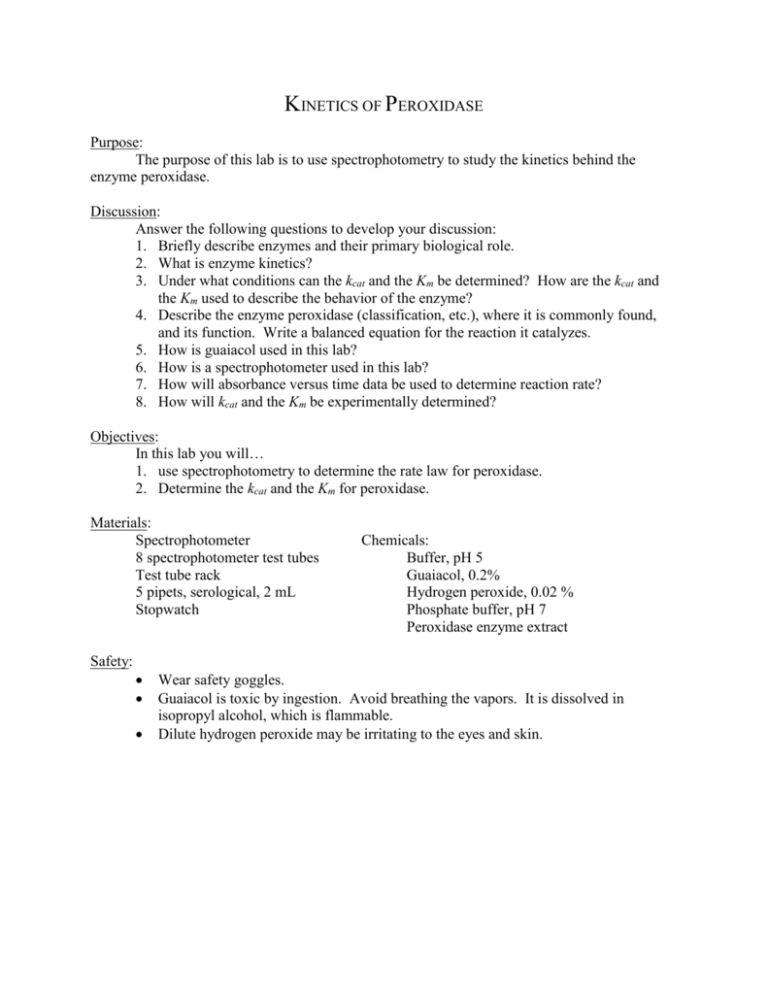
KINETICS OF PEROXIDASE Purpose: The purpose of this lab is to use spectrophotometry to study the kinetics behind the enzyme peroxidase. Discussion: Answer the following questions to develop your discussion: 1. Briefly describe enzymes and their primary biological role. 2. What is enzyme kinetics? 3. Under what conditions can the kcat and the Km be determined? How are the kcat and the Km used to describe the behavior of the enzyme? 4. Describe the enzyme peroxidase (classification, etc.), where it is commonly found, and its function. Write a balanced equation for the reaction it catalyzes. 5. How is guaiacol used in this lab? 6. How is a spectrophotometer used in this lab? 7. How will absorbance versus time data be used to determine reaction rate? 8. How will kcat and the Km be experimentally determined? Objectives: In this lab you will… 1. use spectrophotometry to determine the rate law for peroxidase. 2. Determine the kcat and the Km for peroxidase. Materials: Spectrophotometer 8 spectrophotometer test tubes Test tube rack 5 pipets, serological, 2 mL Stopwatch Chemicals: Buffer, pH 5 Guaiacol, 0.2% Hydrogen peroxide, 0.02 % Phosphate buffer, pH 7 Peroxidase enzyme extract Safety: Wear safety goggles. Guaiacol is toxic by ingestion. Avoid breathing the vapors. It is dissolved in isopropyl alcohol, which is flammable. Dilute hydrogen peroxide may be irritating to the eyes and skin. Procedure: Varying Enzyme Concentration 1. Turn on the spectrophotometer, adjust the wavelength to 500 nm, pull out the 2nd order filter to the appropriate color, and let it warm up for 15 minutes. 2. Prepare a blank by combining 4 mL of pH 5 buffer, 2 mL of 0.02% H2O2, 1 mL of 0.2% guaiacol, and 2 mL of phosphate buffer in a spectrophotometer tube. Be sure to properly prepare the pipets. 3. Zero the spectrophotometer (adjust to 100% transmittance) at 500 nm using the blank solution. 4. Prepare three series of spectrophotometer tubes containing substrates (tube S) and the enzyme (tube E) with buffers as shown in the table below. Note that the enzyme concentration is varied in Trials 1-3 but that the concentration of substrate and the total volumes are held constant. All volumes are in mL. Tube pH 5 buffer H2O2 Guaiacol Peroxidase Phosphate buffer Trial 1 S1 E1 1 2 2 1 0.1 1.9 Trial 2 S2 E2 1 2 2 1 0.25 1.75 Trial 3 S3 E3 1 2 2 1 0.5 1.5 Trial 4 S4 E4 1 2 2 1 1 1 Trial 5 S5 E5 1 2 2 1 2 0 5. When ready to begin trial 1 for the kinetics run, carefully pour the contents of tube S1 into tube E1 and immediately start timing. Pour the combined contents back into tube S1, wipe the outside of the tube with a tissue, and place the tube into the spectrophotometer. 6. Measure and record the absorbance as a function of time every 10 seconds for the first minute, then every 20 seconds for the remaining 240 seconds (300 seconds total). 7. Repeat steps 5 and 6 for the remaining two trials with different concentrations of the enzyme. Varying Substrate Concentration 8. Repeat the experiment varying the concentration of the substrate (H2O2) using the concentrations of the substrate and phosphate buffer from the table below. Again, all volumes are in mL. Tube pH 5 buffer H2O2 Guaiacol Peroxidase Phosphate buffer Trial 1 S1 E1 2.9 2 0.1 1 1 1 Trial 2 S2 E2 2.75 2 0.25 1 1 1 Trial 3 S3 E3 2.5 2 0.5 1 1 1 Trial 4 S4 E4 2 2 1 1 1 1 Trial 5 S5 E5 1 2 2 1 1 1 Cleanup: All solutions in test tubes can be dumped down the drain with running water. Clean and dry all equipment used in the lab. Return equipment to its proper location. Wash your hands before leaving the lab area. Data: Tabulate the absorbance recorded for solutions versus time in separate data tables for varying enzyme concentration and for varying substrate concentration. Tabulate enzyme concentration versus reaction rate and substrate concentration versus reaction rate. Analysis: Varying Enzyme Concentration 1. Graph absorbance versus time for each trial. 2. Graph enzyme concentration versus rate. 3. Determine the kcat. Varying Substrate Concentration 1. Graph absorbance versus time for each trial. 2. Graph substrate concentration versus rate. 3. Determine the Km. Error: Pool class data on kcat and Km, and calculate standard deviations for both values.
