Residual Plots in Linear Regression: A Guide
advertisement
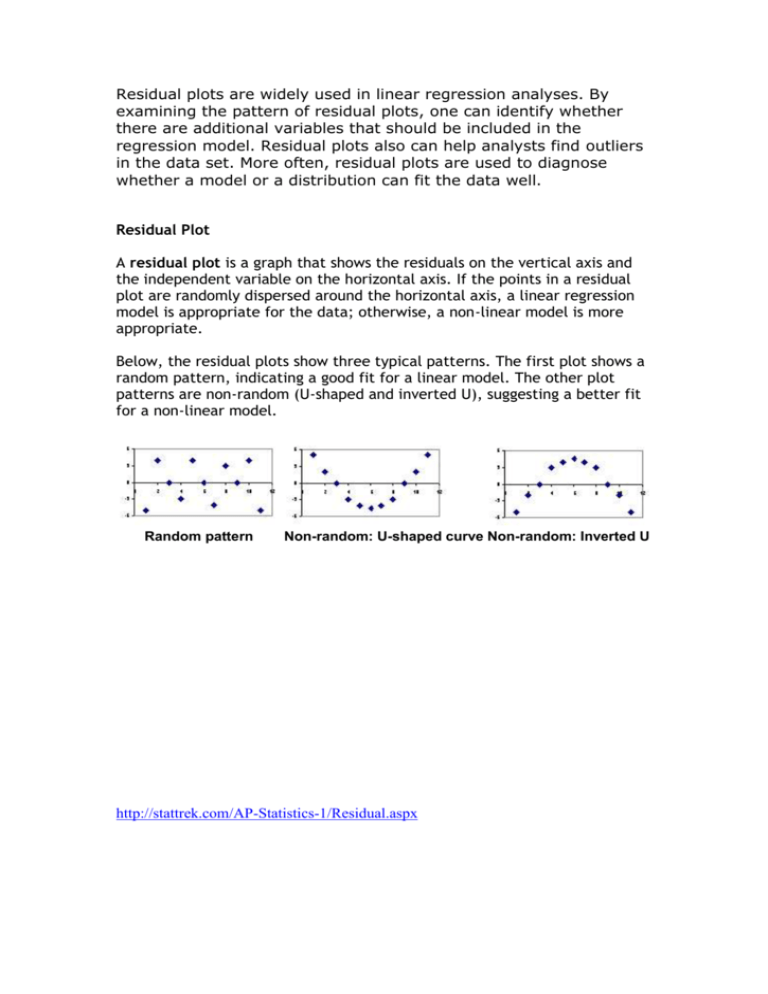
Residual plots are widely used in linear regression analyses. By examining the pattern of residual plots, one can identify whether there are additional variables that should be included in the regression model. Residual plots also can help analysts find outliers in the data set. More often, residual plots are used to diagnose whether a model or a distribution can fit the data well. Residual Plot A residual plot is a graph that shows the residuals on the vertical axis and the independent variable on the horizontal axis. If the points in a residual plot are randomly dispersed around the horizontal axis, a linear regression model is appropriate for the data; otherwise, a non-linear model is more appropriate. Below, the residual plots show three typical patterns. The first plot shows a random pattern, indicating a good fit for a linear model. The other plot patterns are non-random (U-shaped and inverted U), suggesting a better fit for a non-linear model. Random pattern Non-random: U-shaped curve Non-random: Inverted U http://stattrek.com/AP-Statistics-1/Residual.aspx --- What to plot What are the predictor variables? Which is the response variable? Scatterplots try each of the predictors v the response what is the relationship - do they have a high 'little r'? is it sensible to do a linear or non-linear regression ? Regression If they have a moderate to strong relationship do regression analysis - what does the equation mean in terms of your variables? What is the value of big R2? outliers - are there any? What happens when you remove them? residual plot what is the shape and scatter - was linear regression appropriate? Intrapolation - does it give an 'accurate' result? Extrapolation - does it give sensible predictions
