AP Statistics Worksheet Linear Regression
advertisement
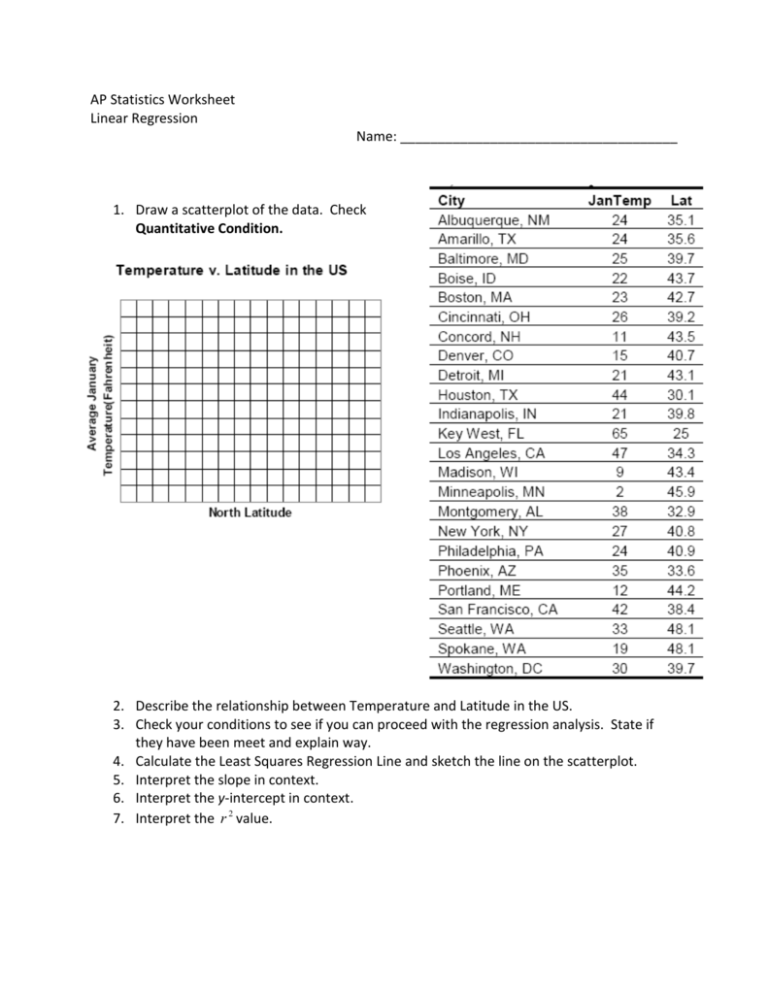
AP Statistics Worksheet Linear Regression Name: _____________________________________ 1. Draw a scatterplot of the data. Check Quantitative Condition. 2. Describe the relationship between Temperature and Latitude in the US. 3. Check your conditions to see if you can proceed with the regression analysis. State if they have been meet and explain way. 4. Calculate the Least Squares Regression Line and sketch the line on the scatterplot. 5. Interpret the slope in context. 6. Interpret the y-intercept in context. 7. Interpret the r 2 value. 8. Fill in the chart below and then create the residual plot. 9. Is the model we determined appropriate for the given data? Explain . 10. What would you predict the Average January Temperature to be in Mobile, AL (Lat=31.2N)? How does this prediction compare to the actual temperature of 44 degrees? What is the residual of that point?
