EC129.C.12 Rajan and Zingales
advertisement
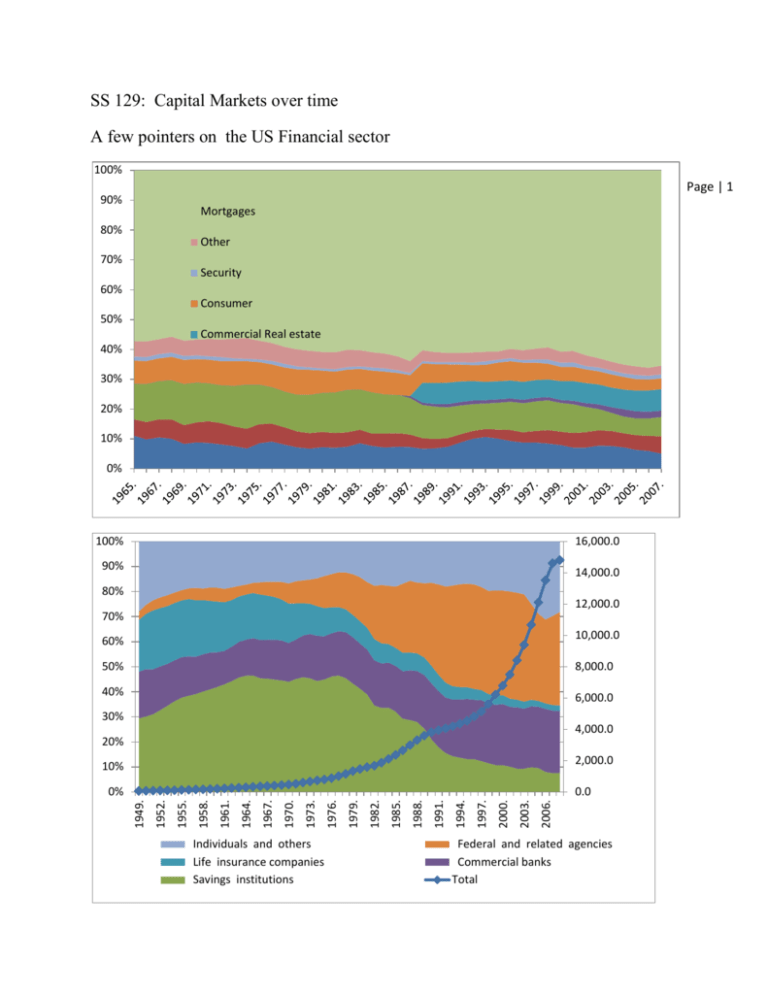
SS 129: Capital Markets over time A few pointers on the US Financial sector 100% Page | 1 90% Mortgages 80% Other 70% Security 60% Consumer 50% Commercial Real estate 40% 30% 20% 10% 0% 100% 16,000.0 90% 14,000.0 80% 12,000.0 70% 10,000.0 60% 50% 8,000.0 40% 6,000.0 30% 4,000.0 20% 2,000.0 10% Individuals and others Life insurance companies Savings institutions 2006. 2003. 2000. 1997. 1994. 1991. 1988. 1985. 1982. 1979. 1976. 1973. 1970. 1967. 1964. 1961. 1958. 1955. 1952. 0.0 1949. 0% Federal and related agencies Commercial banks Total 100.00% Nonprime Mortgage Conditions in the United States Page | 2 90.00% Percent Current 80.00% 70.00% Alternate FRM Alternate Balloon Alternate ARM Supbrime FRM 60.00% 50.00% 40.00% Credit Market borrowing ALL SECTORS, BY INSTRUMENT Total. 2000 2002 2004 2006 2007 1,721.6 2,387.6 3,141.8 4,065.2 4,394.9 Open market paper. 211.6 -99.1 106.2 317.1 -169.4 Treasury securities. -294.9 257.1 362.5 183.7 237.5 433.9 547.2 122.3 330.6 908.3 Agency- and GSE-backed securities 1. Municipal securities. 23.6 159.4 130.5 177.3 215.4 Corporate and foreign bonds. 358.2 559.2 845.7 1,256.1 1,145.2 Bank loans n.e.c. . 113.3 -80.2 72.7 123.1 330.2 Other loans and advances. 137.8 32.0 128.6 157.2 508.9 Mortgages. 561.5 904.1 1,258.1 1,415.6 1,083.0 Consumer credit. 176.5 107.9 115.0 104.4 136.0 Credit Market borrowing . Item 2000 2002 2004 2006 2007 NONFINANCIAL SECTORS Domestic. 864.8 1,414.5 1,999.4 2,428.4 2,515.5 864.8 1,414.5 1,999.4 2,428.4 2,515.5 Household sector. 583.5 832.8 1,066.8 1,204.6 880.6 Nonfinancial business. 560.3 180.1 455.4 889.4 1,211.6 By sector. Corporate. 361.9 23.1 204.8 521.1 787.0 Nonfarm noncorporate. 196.4 149.8 244.5 349.9 415.9 2.0 7.1 6.0 18.4 8.7 16.9 295.9 144.1 115.4 151.1 186.1 257.6 361.9 183.4 237.1 124.3 Farm. State and local governments. Federal Government. Foreign borrowing in the United States. 63.0 93.4 154.7 331.3 Commercial paper. 31.7 58.8 68.7 97.1 -67.4 Bonds. 21.2 31.6 85.8 227.8 170.7 Bank loans n.e.c. . 11.4 5.3 3.8 13.8 24.1 Other loans and advances. -1.3 -2.3 -3.6 -7.4 -3.2 927.8 1,507.9 2,154.2 2,759.8 2,639.7 794.1 879.2 987.0 1,304.7 1,753.4 60.0 49.7 78.4 177.4 263.2 36.8 29.9 18.7 107.5 131.8 Nonfinancial domestic and foreign borrowing. FINANCIAL SECTORS By sector. Commercial banking. U.S.-chartered commercial banks. Foreign banking offices in the United States. Bank holding companies. Savings institutions. Credit unions. Life insurance companies. 0.0 -.4 .1 -.3 .0 23.2 20.3 59.5 70.2 131.3 27.3 -23.4 89.0 -111.9 105.2 0.0 2.0 2.3 4.2 13.4 -0.7 2.0 3.0 2.7 14.5 Government-sponsored enterprises. 235.2 219.8 75.0 35.6 282.4 Agency- and GSE-backed mortgage pools 1. 199.7 326.8 47.9 295.4 626.3 Asset-backed securities issuers. 169.5 221.7 446.2 807.9 332.1 86.3 66.2 134.3 34.8 24.9 2.6 27.3 98.3 22.9 -3.5 Finance companies. REITs 2. Brokers and dealers. 15.6 -1.7 15.2 6.4 -4.0 Funding corporations. -1.6 -10.7 -2.2 29.9 100.7 Notice (1) the size of different sectors matters (no equity yet) So now to Rajan and Zingales Traditional story: markets are big in Common law country? Page | 3 Why? But how large is the bias? Today? But is this true over time? Look back in the 1970s (common law countries have a big advantage) Look further back to 1913 (they no longer have the advantage) What is going on? First phase of Financial development runs 1800-1860. Focused on banks and local exchanges (true in many industrializing countries) Then starting in the 1860s a second phase. More focused on national exchanges and international capital flows. That phase ends with WWI and these types of institutions are less important than national government funding until the 1970s when we return to more important equity markets and more international capital flows How is this connected to common law civil law? How is this connected to wars? How is this connected to international trade How is this connected to political change Page | 4

