Table 1: Error and Uncertainties: Temperature was measured using
advertisement
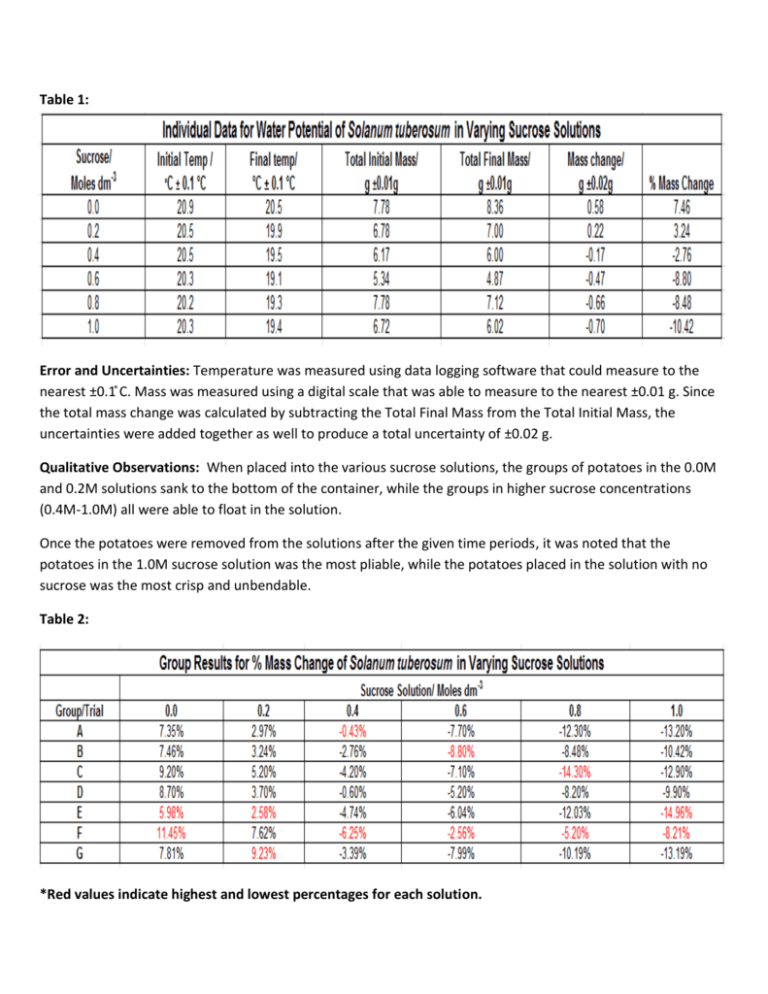
Table 1: Error and Uncertainties: Temperature was measured using data logging software that could measure to the nearest ±0.1 C ̊ . Mass was measured using a digital scale that was able to measure to the nearest ±0.01 g. Since the total mass change was calculated by subtracting the Total Final Mass from the Total Initial Mass, the uncertainties were added together as well to produce a total uncertainty of ±0.02 g. Qualitative Observations: When placed into the various sucrose solutions, the groups of potatoes in the 0.0M and 0.2M solutions sank to the bottom of the container, while the groups in higher sucrose concentrations (0.4M-1.0M) all were able to float in the solution. Once the potatoes were removed from the solutions after the given time periods, it was noted that the potatoes in the 1.0M sucrose solution was the most pliable, while the potatoes placed in the solution with no sucrose was the most crisp and unbendable. Table 2: *Red values indicate highest and lowest percentages for each solution. Table 3: Table 4: *In order to eliminate outliers, the highest and lowest values from the group data for each solution were removed and the data was processed again for comparison. Standard deviation was calculated using Microsoft Excel. It can be hand calculated by the equation: http://ellemedit1234.wordpress.com/2013/05/05/the-maths-of-biology/ Standard Error of Mean (S.E.M.) was used in order to determine how well the group data would represent the actual water potential of the potatoes in a given solution. The smaller the S.E.M., the closer the data would be to the true mean. This was calculated by taking the standard deviation and dividing by the square root of the population sample size. Figure 1: Group Mean % Mass Change of Solanum tuberosum in Varying Sucrose Solutions 15.00% Mean % mass change 10.00% Percent (%) Msss Change of Potatoes % Mass Change excluding Highest and lowest values y = -0.2127x + 0.0757 R² = 0.9582 5.00% Isotonic Solution = 0.36 moles dm-3 % Mass Change including outliers Linear (% Mass Change excluding Highest and lowest values) 0.00% 0.0 0.2 0.4 0.6 Isotonic Solution= 0.35 moles dm-3 -5.00% y = -0.2117x + 0.0734 R² = 0.9607 -10.00% -15.00% Sucrose Solution/Moles dm-3 0.8 1.0 Figure 2: Individual Data for Water Potential of Solanum tuberosum in Varying Sucrose Solutions 10.00 8.00 % Mass Change of Potatoes 6.00 y = -18.657x + 6.0352 R² = 0.9139 4.00 Isotonic Solution= 0.32 moles dm-3 2.00 0.00 0.0 0.2 0.4 0.6 -2.00 0.8 1.0 % Mass Change Linear (% Mass Change) -4.00 -6.00 -8.00 -10.00 -12.00 Sucrose Solution/ moles dm-3 *Isotonic solution point for each line was determined by calculating the x-intercept from the equation given for each trend line in figures 1 and 2. Conclusion and Evaluation: Osmosis is a process in which water will move from an area of low solute concentration to an area of higher solute concentration. This investigation allowed us to be able to estimate an average solute concentration within the Solanum tuberosum. By varying the solute concentration of sucrose dissolved in distilled water, we were able to measure the mass change of S. tuberosum and determine the net movement of water either into or out of the potato. Looking at tables three and four, we can see that the mass of S. tuberosum increased when placed in 0.0 and 0.2 molar sucrose solutions, which indicated that the potatoes have a higher concentration of solutes than the solutions they were placed in. For the samples placed in 0.4M to 1.0M sucrose solutions, the mass tended to decrease; most dramatically in the 1.0M sucrose solution. However, the potatoes in the 0.4M solution showed the least mass change between -3.14% and -3.20% which suggests that S. tuberosum has a solute concentration a little less than 0.4M , which is consistent with the isotonic solution calculations shown in figures 1 and 2 that are between 0.32 and 0.36M. All three trend lines show a relatively high r2 value above .90 which suggests a strong correlation between increasing solute concentration and mass change. The strongest correlation was .9607 which was seen in the data where the outliers had been eliminated. In processing the data, it was noticed that there were several sets of data that seemed as outliers when compared to the other groups’ data. In order to see how these values may have altered the sample, standard deviation and standard error of mean was calculated with the outliers and without. Evaluating the calculations there was a small difference between the two. The data including the outliers saw an increase in the percent mass change for each of the groups typically when compared to the data without the highest and lowest values. It can also be seen that the S.E.M. also decreases significantly with the highest and lowest values removed making the data less variable and more representative of the mean mass change for S. tuberosum in various solute concentrations. There was a lot of variation within the sets of data for each solution used which can be contributed to several different factors. Each group was required to cut their own S. tuberosum pieces for each testing solution. This can provide a lot of variation for each sample group which might possibly affect the outcome. Since a percent mass change was used, the significance of the different potato slices may have been minimized. Another factor that may have affected the outcome was the environment temperature. Each sample was placed in a separate container at room temperature. As one can see, the temperature did not stay constant for each of the samples. This may have altered the speed of which water was able to move in or out of the potato slices since molecules will speed up or slowdown in response to change in temperature. In order to keep temperature constant, it may have been better to place each sample in a warm water bath after they were placed in each solution. Lastly, it is known that each sample of S. tuberosum may not have had the same water potential. In nature there is always variation between individuals and even within individuals. In preparations, potato slices were pre made and the individual disks were cut to size. In order to help minimize the variability of the tissue, each group could use their own potato and cut their pieces themselves. This would make sure that the tissue pieces would be as uniform as possible.
