Name: Dr. Kelly AP Biology Diffusion and Osmosis Lab Report
advertisement
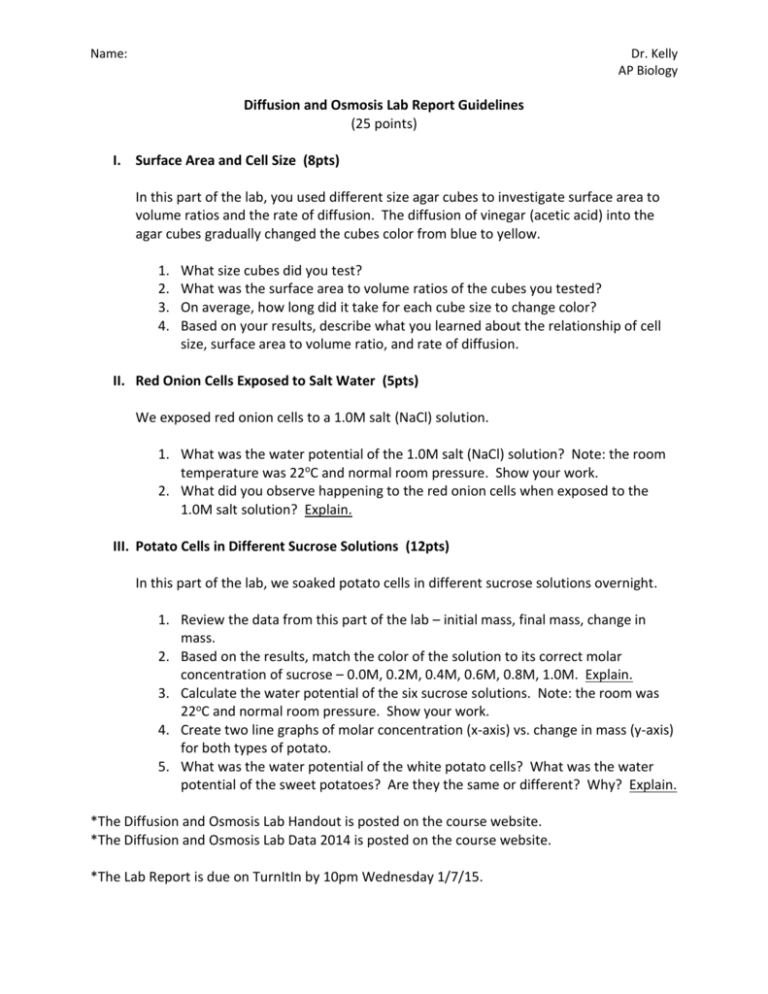
Name: Dr. Kelly AP Biology Diffusion and Osmosis Lab Report Guidelines (25 points) I. Surface Area and Cell Size (8pts) In this part of the lab, you used different size agar cubes to investigate surface area to volume ratios and the rate of diffusion. The diffusion of vinegar (acetic acid) into the agar cubes gradually changed the cubes color from blue to yellow. 1. 2. 3. 4. What size cubes did you test? What was the surface area to volume ratios of the cubes you tested? On average, how long did it take for each cube size to change color? Based on your results, describe what you learned about the relationship of cell size, surface area to volume ratio, and rate of diffusion. II. Red Onion Cells Exposed to Salt Water (5pts) We exposed red onion cells to a 1.0M salt (NaCl) solution. 1. What was the water potential of the 1.0M salt (NaCl) solution? Note: the room temperature was 22oC and normal room pressure. Show your work. 2. What did you observe happening to the red onion cells when exposed to the 1.0M salt solution? Explain. III. Potato Cells in Different Sucrose Solutions (12pts) In this part of the lab, we soaked potato cells in different sucrose solutions overnight. 1. Review the data from this part of the lab – initial mass, final mass, change in mass. 2. Based on the results, match the color of the solution to its correct molar concentration of sucrose – 0.0M, 0.2M, 0.4M, 0.6M, 0.8M, 1.0M. Explain. 3. Calculate the water potential of the six sucrose solutions. Note: the room was 22oC and normal room pressure. Show your work. 4. Create two line graphs of molar concentration (x-axis) vs. change in mass (y-axis) for both types of potato. 5. What was the water potential of the white potato cells? What was the water potential of the sweet potatoes? Are they the same or different? Why? Explain. *The Diffusion and Osmosis Lab Handout is posted on the course website. *The Diffusion and Osmosis Lab Data 2014 is posted on the course website. *The Lab Report is due on TurnItIn by 10pm Wednesday 1/7/15.
