Bartlett IPS Unit planner, Unit three revised - career
advertisement
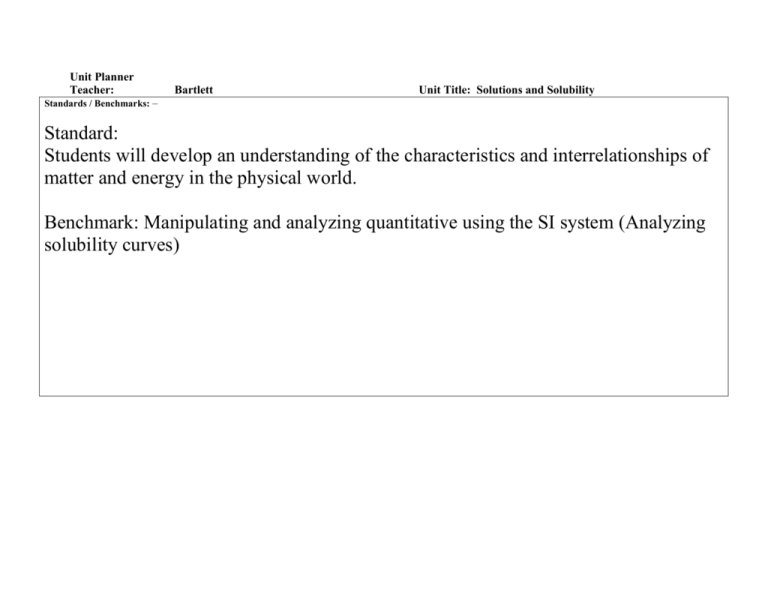
Unit Planner Teacher: Bartlett Unit Title: Solutions and Solubility Standards / Benchmarks: – Standard: Students will develop an understanding of the characteristics and interrelationships of matter and energy in the physical world. Benchmark: Manipulating and analyzing quantitative using the SI system (Analyzing solubility curves) Standards Analysis: .What students are expected to know: 1)The effects of temperature on the solubility of a gas and on a solid Critical Questions or Statements: Relevance: Meaningful context for teaching these Essential learning for this Unit standards and benchmarks that engages [even reluctant learners] students in learning? Is there a limit as to how much solute can dissolve in a solvent and how does this relate to a solubility curve? What students are expected to do: 2)Reading and interpreting and creating solubility Curves 3) Predicting the amount of solid that will dissolved or the amount of precipitate produced at a given temperature 4) Calculating concentration of a solution How do we make a saturated solution? 5) Determining the type of solution (saturated, supersaturated or unsaturated). How does the concentration of a saturated solution of NaCl and KCl compare? 6) Know terms such as precipitate, solute, solvent, concentrated, saturated, supersaturated and unsaturated solutions. Can you differentiate between density and concentration? 7) Create and analyze solubility graphs. What is the effect of temperature on solubility? Are all solutes soluble in all solvents How is the concentration of a saturated solution calculated? . This unit requires that the students spend a great deal of time creating and analyzing graphs. This is an essential skill required for all future science courses. Pre-assessment tools / strategies: Differentiation strategies: Pre-assess by brain storming terms that relate to solubility and have a class discussion of these terms to determine the student’s prior knowledge. Hel sessions for those who need more practice with graphing. Final Assessment(s) - Body of Evidence How can students show what they know Instructional Strategies: How will students learn this? and can do? 1.Graphs 1.Lab Does temperature effect the solubility of a salt 2. Worksheets (practice graphing) 2. Lab report (The solubility of KNO3) 3. Power points Lecture notes 4. Lab: Calculating the concentration of a saturated solution. 3.Test Formative assessments / assignments – including classroom and homework – How will you know students have learned this? 1. Lab report (the solubility of KNO3 2. Graph worksheet 3. Test 4. Solubility curve

