1-3 Simulation and Statistical Significance
advertisement
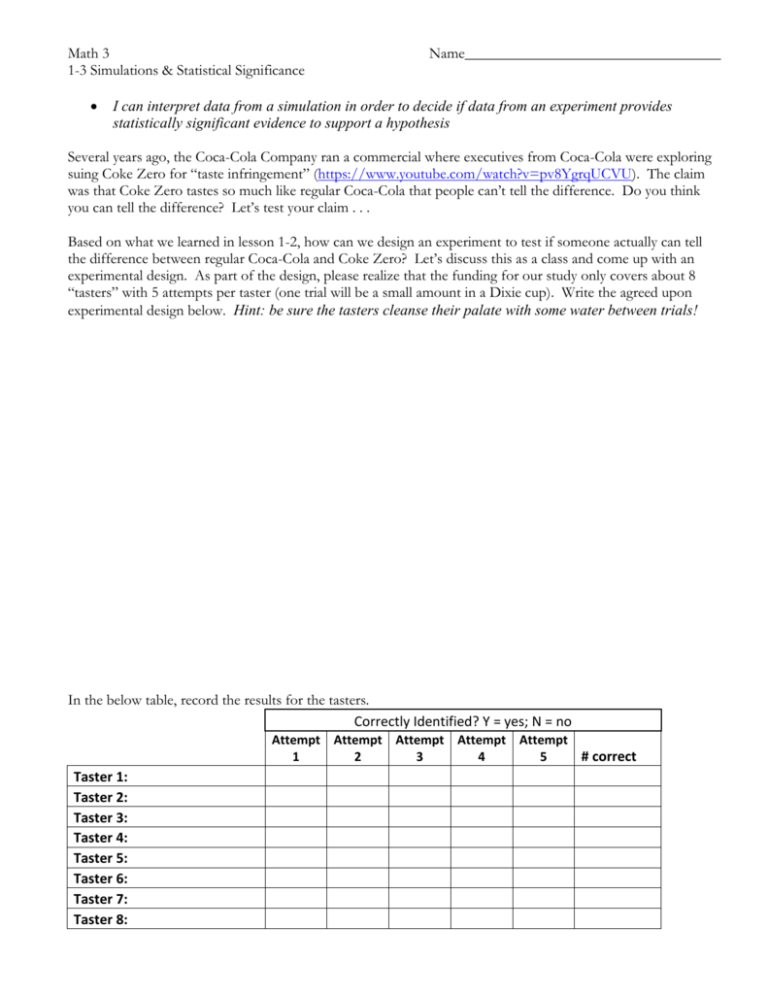
Math 3 1-3 Simulations & Statistical Significance Name__________________________________ I can interpret data from a simulation in order to decide if data from an experiment provides statistically significant evidence to support a hypothesis Several years ago, the Coca-Cola Company ran a commercial where executives from Coca-Cola were exploring suing Coke Zero for “taste infringement” (https://www.youtube.com/watch?v=pv8YgrqUCVU). The claim was that Coke Zero tastes so much like regular Coca-Cola that people can’t tell the difference. Do you think you can tell the difference? Let’s test your claim . . . Based on what we learned in lesson 1-2, how can we design an experiment to test if someone actually can tell the difference between regular Coca-Cola and Coke Zero? Let’s discuss this as a class and come up with an experimental design. As part of the design, please realize that the funding for our study only covers about 8 “tasters” with 5 attempts per taster (one trial will be a small amount in a Dixie cup). Write the agreed upon experimental design below. Hint: be sure the tasters cleanse their palate with some water between trials! In the below table, record the results for the tasters. Correctly Identified? Y = yes; N = no Attempt Attempt Attempt Attempt Attempt # correct 1 2 3 4 5 Taster 1: Taster 2: Taster 3: Taster 4: Taster 5: Taster 6: Taster 7: Taster 8: Data Analysis 1. In the above example, 1 trial of our experiment consists of one taster performing 5 attempts. How many total trials of our experiment were performed? 2. Based on the results in the table above, do you think any of the tasters can tell the difference between Coca-Cola and Coke Zero? Explain. 3. Mathematically, how can you justify your answer to question (1)? 4. Let’s assume for a moment that no one can tell the difference between Coca-Cola and Coke Zero. If that were true, what would our tasters be doing when asked which drink they had tasted? What would be the probability that they were correct? In a well designed experiment, you have a control group and a treatment group (or two treatment groups). If you are trying to compare the data from two different groups, there will generally be a difference in the means of the two groups (it is highly unlikely the difference in means will be zero). Just because there is a difference, does that mean that our treatment was effective? A simulation can help us to determine if our data provides statistically significant difference in the means of the two groups. Statistically significant means that the difference is likely due to the treatment and not just to random chance. Watch the following video on how to set-up and run a simulation. While you will never be asked to run a simulation yourself, it will be helpful to you to understand how they are set up and how they are run. http://learnzillion.com/lessons/3124-test-a-model-using-a-simulation-with-random-numbers 6. Below is a histogram of a simulation of 1,000 trials of our experiment. The y-axis is the relative frequency (exact values are labeled on the top of each bar) of each response. Based on the results from our experiment and the histogram at the right, do you think that any of our tasters can tell the difference between Coca-Cola and Coke Zero? Explain. Notes on Statistical Significance 7. Go back to the penny stacking data from Lesson 1-2. What is the difference in means of the dominant and group and the non-dominant hand group. That is, find xdominant xnon-dominant 8. A randomization test of our class data for the penny stacking experiment was performed (1,000 trials). The results are in the histogram below. The y-axis is frequency. 8a. Put a vertical line in the graph where the difference for our class is located. 8b. What is the probability of getting a difference as extreme or more extreme than the difference from our experiment? 8c. Does the data say that there is a significant difference between stacking pennies with your dominant versus non-dominant hand? Explain. Chrysanthemums (kri-san-thuh-muh ms) with long stems are likely to have smaller flowers than chrysanthemums with shorter stems. An experiment was conducted at the University of Florida to compare growth inhibitors designed to reduce the length of the stems, therefore increasing the size of the flowers. Growth inhibitor A was given to 10 randomly selected plants. Growth inhibitor B was given to the remaining 10 plants. The plants were grown under nearly identical conditions, except for the growth inhibitor used. The table below gives the amount of growth during the subsequent 10 weeks. 9a. Does this experiment have the characteristics of a well designed experiment? 9b. Examine the summary statistics and plots at the right. Which growth inhibitor appears to be more effective? Explain. 9c. What is the difference in means in the two groups? 9d. At the right is a histogram of the results from a randomization test for the chrysanthemum data. What is the probability of getting a difference as extreme or more extreme as the difference from our experimental data? 9e. Do you have enough evidence to say that there is a statistically significant difference in the two growth inhibitors? Explain. In this investigation, you explored the randomization test. This test is one method of determining whether a difference between two treatment groups can be reasonably attributed to the random assignment of treatments to subjects or whether you should believe that the treatments caused the difference. 10. Explain the below statement: Even if the response for each subject would be the same no matter which treatment he or she receives, there is almost always a nonzero difference in the means of the actual responses from the two treatments. 11. What does it mean if the results of an experiment are called “statistically significant”
