Supplementary Table 2 (docx 30K)
advertisement
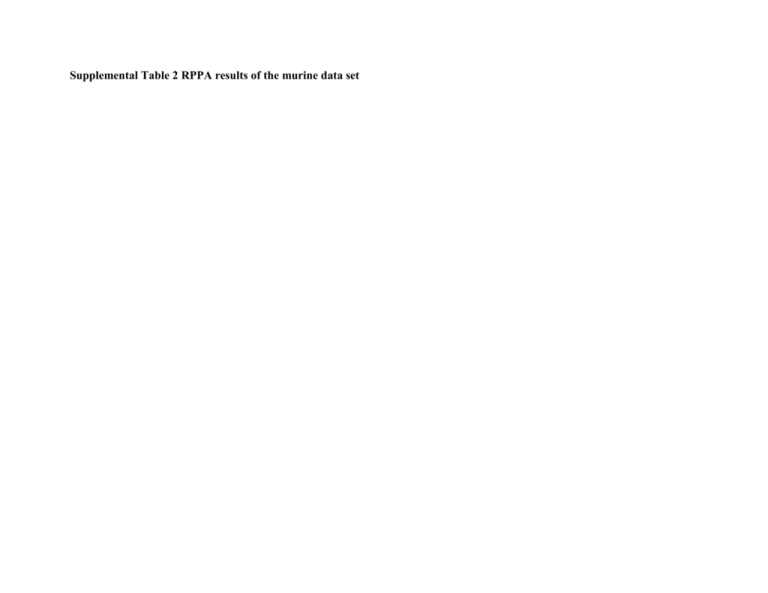
Supplemental Table 2 RPPA results of the murine data set ischemia RT [h] 0 p-HER2 (Y1248) 43 26 25 25 26 90 89 81 76 82 83 72 71 75 91 114 79 85 84 108 102 71 85 73 63 73 90 76 69 68 47 62 53 49 32 24 36 74 68 68 51 57 55 49 43 37 43 62 45 28 33 37 44 70 72 72 64 CF 66 77 69 69 SF 100 61 56 72 51 SF SF SF CF p-Akt (S473) 100 100 SF 100 100 CF p-GSK3beta (S9) SF 100 CF p-PRAS40 (T246) SF 100 CF p-mTOR (S2448) p-4E-BP1 (T37/46) 5 54 100 CF p-PTEN (S380) 3 47 CF p-EGFR (Y1148) 1 45 SF CF p-HER3 (Y1289) 0.5 SF 100 ischemia 4°C [h] 24 17 36 73 30 34 29 20 35 0 0.5 1 3 5 Sensitivity 24 73 98 49 57 30 68 76 52 57 17 113 100 89 101 75 90 88 82 80 62 78 75 83 80 95 74 100 75 68 56 81 86 89 97 54 73 91 67 81 52 74 76 52 36 41 67 70 51 48 26 85 76 82 80 53 66 73 73 68 36 51 69 75 47 30 50 72 64 46 25 80 77 86 80 64 77 85 75 75 56 100 116 117 127 93 63 100 100 100 100 100 100 100 100 against ischemia Relative signal intensity difference between SF vs. CF reference (CF set as 100%) +++ 59 + 88 + 174 + 98 +++ 81 ++ 73 ++ 86 + 105 ++ 84 49 CF p-S6RP (S235/236) SF 100 CF p-p38 MAPK (T180/Y182) SF CF p-Erk-1/2 (T202/Y204) SF CF p-NFkappaB p65 (S536) SF 100 100 100 CF p-STAT3 (S727) SF CF p-STAT5 (Y694) SF CF HER2 DAKO SF 100 100 100 CF HER2 CB11 SF CF ERalpha SF CF PgR SF CF 100 100 100 45 61 42 109 102 85 92 100 111 91 101 100 78 83 69 65 62 54 43 33 28 34 25 22 22 23 21 50 57 64 49 30 34 37 34 71 97 100 76 70 95 94 89 87 94 111 96 94 115 130 89 78 94 86 87 85 104 91 104 83 85 86 85 87 96 86 98 74 76 80 74 97 113 91 89 40 83 91 57 44 74 88 96 52 60 30 16 24 50 100 49 64 50 40 108 100 100 100 100 100 100 100 100 100 100 75 102 94 41 114 110 120 99 98 97 81 86 107 94 108 97 111 112 70 80 97 86 99 42 41 48 51 29 19 35 62 39 26 15 65 89 65 69 39 63 70 51 62 26 82 68 84 94 84 71 87 74 90 78 113 138 111 112 91 137 94 102 128 87 84 88 74 101 61 87 83 79 87 52 76 87 80 82 68 90 90 81 88 69 82 60 85 76 78 92 109 85 89 88 42 45 64 77 44 49 82 55 69 47 - 90 ++ 65 +++ 78 ++ 65 + 100 - 109 + 114 -* 111 + 119 ++ 114 Akt SF CF mTOR SF 100 100 CF Cyclin D1 SF CF Cytokeratin 18 SF CF GAPDH SF CF beta-Actin SF CF 100 100 100 100 97 110 106 101 93 119 114 109 35 69 84 56 42 72 88 93 82 113 119 92 71 107 117 101 129 113 82 77 62 111 78 85 110 143 85 98 85 107 96 88 92 95 92 95 108 129 107 91 61 43 85 28 77 64 100 100 100 100 100 100 110 98 151 130 117 104 80 126 125 79 44 41 61 69 42 45 88 56 68 43 84 88 129 119 106 86 83 101 112 89 111 86 105 96 62 65 69 87 81 40 109 119 119 143 77 81 88 81 92 58 109 79 95 98 86 103 105 102 94 87 - 101 ++ 122 + 99 + 70 - 78 - 120 The results are depicted as the mean normalized signal intensity, relative to the respective reference sample (0 h ischemia) which was set as 100%. p-Hsp27 (S82) was not analyzable because protein expression was too weak. = ≥ 25% loss of signal in one or more ischemia + samples compared to reference sample (time point 0) which was set as 100%; 24 h excluded = ≥ 50% loss of signal in one or more ischemia ++ samples compared to reference sample (time point 0) which was set as 100%; 24 h excluded = ≥ 75% loss of signal in one or more ischemia +++ samples compared to reference sample (time point 0) which was set as 100%; 24 h excluded (24 h excluded because after 24 h nearly each protein showed massive loss of signal and the other time points are clinically more relevant) * = not sensitive = the antibody against HER2 clone CB11 is a monoclonal antibody; thus the signals were in general weaker than those revealed by the DAKO antibody against HER2 which is a polyclonal one SF = standard formalin CF = cold formalin RT = room temperature
