supporting data
advertisement
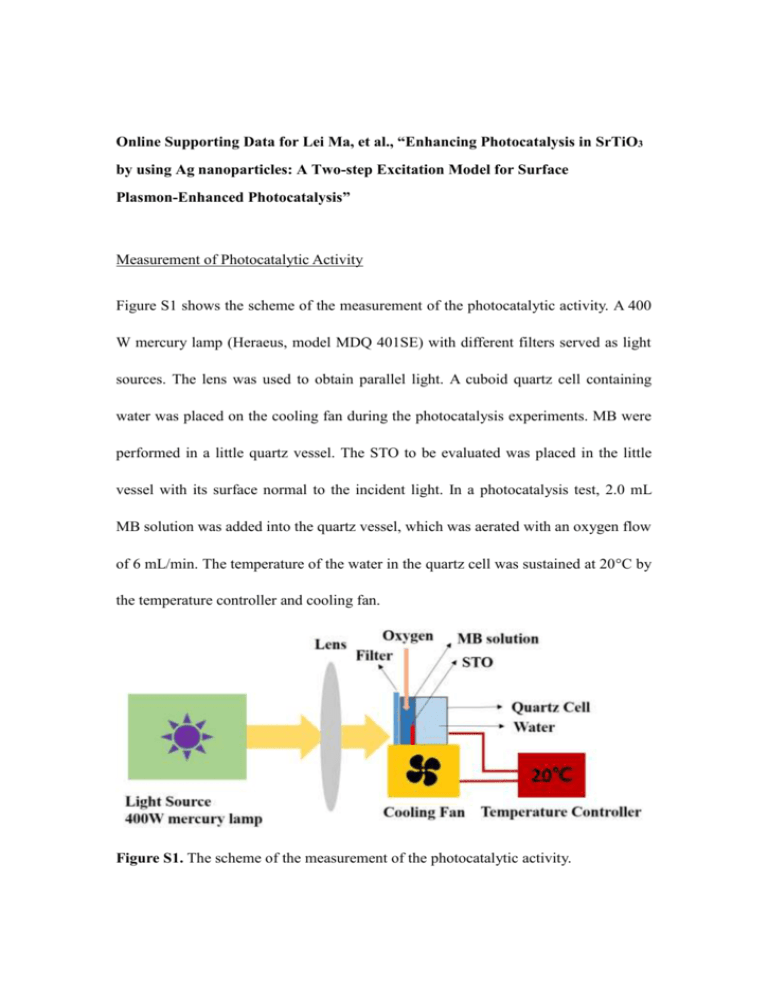
Online Supporting Data for Lei Ma, et al., “Enhancing Photocatalysis in SrTiO3 by using Ag nanoparticles: A Two-step Excitation Model for Surface Plasmon-Enhanced Photocatalysis” Measurement of Photocatalytic Activity Figure S1 shows the scheme of the measurement of the photocatalytic activity. A 400 W mercury lamp (Heraeus, model MDQ 401SE) with different filters served as light sources. The lens was used to obtain parallel light. A cuboid quartz cell containing water was placed on the cooling fan during the photocatalysis experiments. MB were performed in a little quartz vessel. The STO to be evaluated was placed in the little vessel with its surface normal to the incident light. In a photocatalysis test, 2.0 mL MB solution was added into the quartz vessel, which was aerated with an oxygen flow of 6 mL/min. The temperature of the water in the quartz cell was sustained at 20C by the temperature controller and cooling fan. Figure S1. The scheme of the measurement of the photocatalytic activity. Measurement of photoluminescence The STO samples were excited with =532 nm laser beam from a Q-switched Nd: YAG laser (Continuum, model Surelite SLII-10) and =325 nm laser beam from a CW He-Cd laser (Melles Griot, Series 74) at temperatures of 7 K. The excitation laser beam was focused by a plano-convex lens with focus length of 20 cm onto the sample surface at normal incidence. The luminescent light was collected and collimated by the same lens, then focused by another plano-convex lens with focus length of 20 cm into the input slit of the spectrophotometer. The PL spectra were recorded with an intensified charge-coupled device (ICCD) (Andor Technology, model iStar DH720) which was attached to the exit port of a spectrophotometer (Acton Research, model Spectra Pro 500i). A 300 l/mm grating with blazed wavelength of 500nm was used in the spectrophotometer. The input slit width was set to 200 m. Optical filters were installed on the input slit to block the scattered laser light. Ultraviolet and visible light sources used in this work The following is the emission spectrum of Hg lamp and the transmission spectra of the two filters (GUO GUANG Optics, Shanghai) we used. It is seen that for the UV light part, the main portion is 365 nm, and for the visible light, it is composed of 435 nm and some others ranging from ~480 to 550 nm with smaller intensities. Figure S2. The emission spectrum of Hg lamp and the transmission spectra of the two filters we used. Characterization of the influence of Ag-NPs alone on the MB decomposition Since SiO2 has no photocatalytic ability, we prepared Ag-NPs on SiO2 and examined whether the Ag-NP itself can decompose MB under the illumination of visible light (λ=435nm) for 3h. FDTD simulation indicates that SP also exists at the interface between Ag-NP and SiO2 (the left figure below) and the SPR peaks at ~430 nm (the right figure below). However, no decomposition of MB by Ag-NPs happens after 435 nm light illumination for 3 h as shown in the inset of the right figure in the following.. Figure S3. The FDTD simulation results for an Ag-NP ( =80 nm) on SiO2 (left figure), or Ag/SiO2. Absorption spectrum of the Ag/SiO2 system (right figure). The inset shows the absorption spectra of virginal MB with no light illumination, and MB and MB loaded with Ag/SiO2 after 435 nm light illumination for 3 h.
