CHML212
advertisement
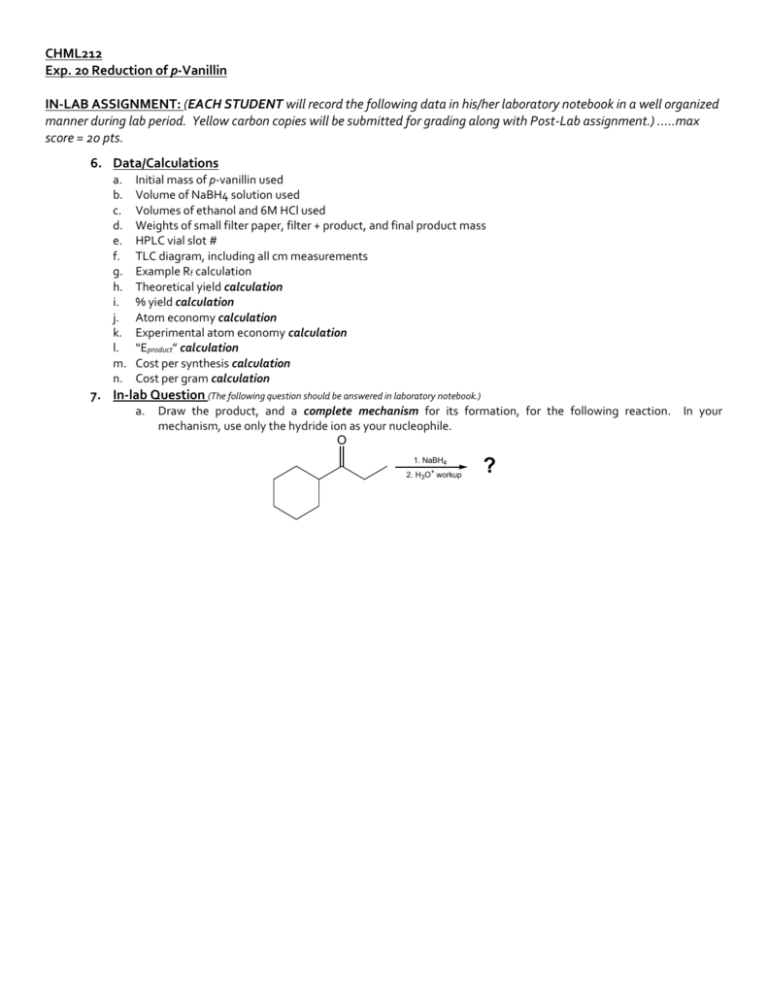
CHML212 Exp. 20 Reduction of p-Vanillin IN-LAB ASSIGNMENT: (EACH STUDENT will record the following data in his/her laboratory notebook in a well organized manner during lab period. Yellow carbon copies will be submitted for grading along with Post-Lab assignment.) …..max score = 20 pts. 6. Data/Calculations a. b. c. d. e. f. g. h. i. j. k. l. m. n. Initial mass of p-vanillin used Volume of NaBH4 solution used Volumes of ethanol and 6M HCl used Weights of small filter paper, filter + product, and final product mass HPLC vial slot # TLC diagram, including all cm measurements Example Rf calculation Theoretical yield calculation % yield calculation Atom economy calculation Experimental atom economy calculation “Eproduct” calculation Cost per synthesis calculation Cost per gram calculation 7. In-lab Question (The following question should be answered in laboratory notebook.) a. Draw the product, and a complete mechanism for its formation, for the following reaction. In your mechanism, use only the hydride ion as your nucleophile. O 1. NaBH4 2. H3O+ workup ? CHML212 Exp. 20 Reduction of p-Vanillin POST-LAB ASSIGNMENT: (EACH LAB GROUP will submit one copy of a typewritten, paragraph style report addressing all of the points listed below. Must be written using PAST TENSE, PASSIVE VOICE. ) …..max score = 50 pts. 8. Experimental (Write 1-2 paragraphs including all of the following. Do NOT present a bulleted outline.) What type of reaction did you perform? Describe the actual synthetic procedure. Include names of any reactants used and desired product, as well as name of solvent and catalyst used (if any). Be sure to give actual volumes/masses of compounds used during the synthesis (not just what the lab manual tells you to use). Describe the purification technique used to isolate the desired product, including names and actual volume/mass of any compounds used during the purification process. Describe the analytical technique used to evaluate the product, including names and actual volumes of any compounds used during sample preparation, and any type of spectral analysis used. 9. Results (Completed tables. Sketch diagram of TLC plate, including all spots. Once complete, copy/paste tables into your document.) Table 20.1 TLC Analysis Compound Standard Rf Sample Rf TLC Diagram Solvent Front = ________ cm p-vanillin Vanillyl Alcohol Table 20.2 IR Analysis OH stretch Base Values Frequency (cm-1) 3200-3600 C-O stretch C=O stretch 1000-1300 1680-1740 Functional Group p-vanillin Vanillyl alcohol Frequency (cm-1) Frequency (cm-1) Table 20.3 1H NMR Analysis p-vanillin O vanillyl alcohol H1 C HO 7 CH2 1 6 2 6 2 5 5 OCH3 OCH3 3 3 OH OH 4 H# 1 2,6 3 4 (OH) 5 4 (ppm) Int. Mult. 7.42 2 m H# 1 2 3 4 (OH) 5,6 7 (OH) (ppm) Int. Mult. 6.71 2 m Table 20.4 Experimental Results Table 20.5 Green Chemistry Results Atom Economy (%) Experimental Atom Economy (%) “Eproduct” Cost per synthesis ($) Cost per gram ($/g) Theoretical yield (g) Actual yield (g) Percent yield Product Appearance Experimental Melting Point (oC) Compound Table 20.6 HPLC Analysis HPLC Retention Times (min) Standard Sample p-vanillin Vanillyl alcohol 10. Discussion (Write 1-2 paragraphs including the following.) Based on TLC and HPLC analyses, was the p-vanillin completely reduced to vanillyl alcohol? Identify any compounds present in the sample. Give HPLC retention times, area percent values, and TLC R f values for any compounds present in the sample. How can IR spectroscopy be used to differentiate between the reactant and the product in this experiment? Give the identity of one type of absorption and explain how it could be used to determine whether or not the conversion took place. Include the typical frequency and the actual frequency for this type of bond in your statement. How can NMR spectroscopy be used to differentiate between the reactant and the product in this experiment? Give the identity of one type of proton and how it could be used to determine whether or not the conversion took place. Include the typical chemical shift and the actual chemical shift for this type of proton in your statement. Include a short comment addressing what could be done differently to improve the experimental results, if repeated. Be sure to attach HPLC chromatogram!
