Biology Journal 2
advertisement
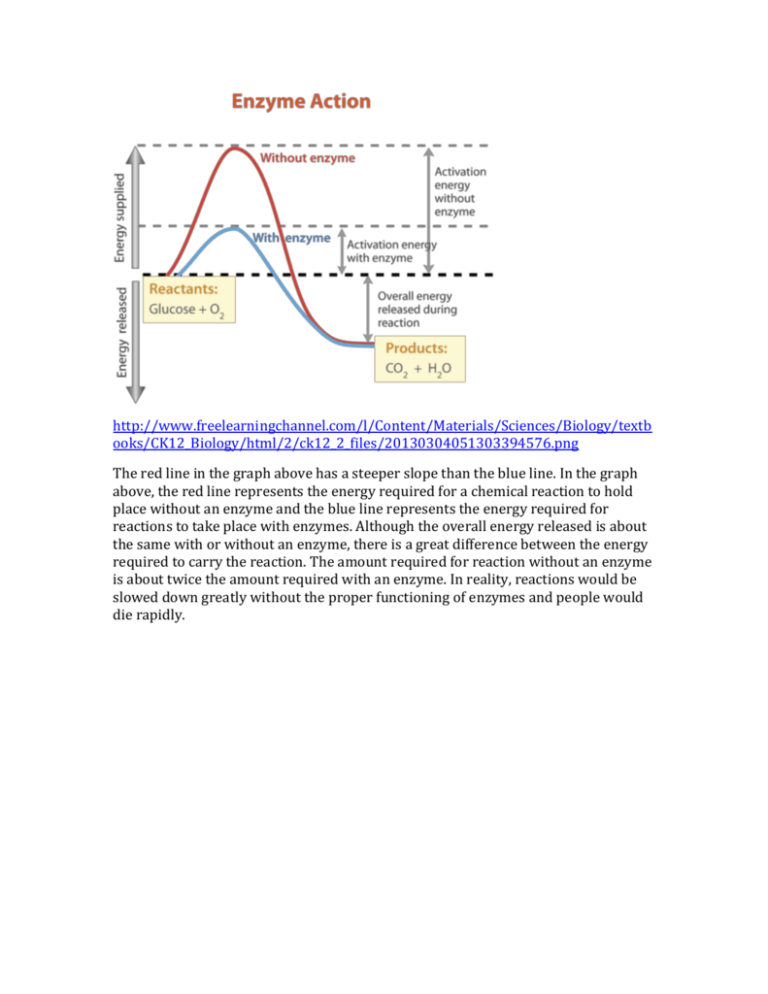
http://www.freelearningchannel.com/l/Content/Materials/Sciences/Biology/textb ooks/CK12_Biology/html/2/ck12_2_files/20130304051303394576.png The red line in the graph above has a steeper slope than the blue line. In the graph above, the red line represents the energy required for a chemical reaction to hold place without an enzyme and the blue line represents the energy required for reactions to take place with enzymes. Although the overall energy released is about the same with or without an enzyme, there is a great difference between the energy required to carry the reaction. The amount required for reaction without an enzyme is about twice the amount required with an enzyme. In reality, reactions would be slowed down greatly without the proper functioning of enzymes and people would die rapidly. In the substrate and reaction rate graph on the left, a positive curve is displayed. In the beginning of the graph, the reaction rate rapidly increases as the amount of substrate increases. As more substrate enters, the enzymes also increases its productivity to keep up with the entrance rate of enzymes but as the amount of substrate increases, the enzyme eventually reaches its maximum reaction rate and even if the substrate amount keep on increasing, the reaction rate won’t rise anymore before other enzymes are produced to help out. There should always be excessive amount of substrate to keep the system working efficiently. In the enzyme concentration and reaction rate graph, a straight, diagonal line is displayed. As the enzyme increases in productivity and amount, the reaction rate also increases along with the enzyme concentration, displaying a positive correlation. As more enzymes are produced, the reaction rate also increases. http://chemwiki.ucdavis.edu/@api/deki/files/25932/18.13.jpg?revision=1 http://alevelnotes.com/content_images/i71_gcsechem_18part2.gif In the graph above, the graph displays an increase until the high point where it begins to drop. The graph above starts with 0 degrees Celsius and ends with 70 degrees Celsius. Every enzyme has an optimum temperature, the temperature where they are most productive in. In the graph above, the productivity of the enzyme increases as the temperature rises (vibration of atoms due to heat) and reaches its high point at 40 degrees Celsius, but once the temperature is above 40 degrees, the graphs value starts to drop. When the temperature gets too hot in an enzyme, the weaker bonds get disrupted and denaturation occurs. The enzyme slowly malfunctions and the productivity drops until the enzyme is fully mutated and unable to function at 63 degrees. http://chemwiki.ucdavis.edu/@api/deki/files/25933/18.14.jpg?revision=1 In the graph to the right is a comparison of reaction rate to pH levels. Similar to temperature, every enzyme has an optimum pH level. As the pH level increases, the productivity also increases. The reaction rate keeps on increasing until the high point and then drops in value. Most enzymes have their optimum pH within pH of 38, where extremely basic or acidic environments will lead to denaturation but there are special cases whose optimum pH are 1 or 2. Inhibitors decrease the productivity and reaction rate of an enzyme. The black line is a normal enzyme, the red line is an enzyme affected by competitive inhibitor and the blue line is an enzyme affected by a noncompetitive inhibitor. The competitive inhibitor takes a similar shape to a substrate and enters the active site but because it can’t carry the reaction, it is stuck in the active site, thus causing reaction rates to drop due to the waste of time. As the concentration of substrates and enzyme increase, the competitive inhibitor will lose its effects (get displaced). The noncompetitive inhibitor on the other hand does not intervene physically with the enzyme’s active site but lowers reaction rates by changing the shape of the active site, causing many substrates to become unable to enter the active site (changes the tertiary level). Although as the concentration of substrate increases the competitive inhibitor becomes ineffective, the noncompetitive inhibitor has a larger effect on the reaction rate until the binding of the non-competitive inhibitor ends. http://faculty.une.edu/com/courses/bionut/distbio/obj-512/Chap9enzymeinhibition.gif http://plantphys.info/plant_physiology/images/enzactiveinhibit.gif The cofactors are inorganic components of the enzyme that helps the enzyme catalyze faster or increase productivity. The Red line is enzyme with inhibitor, the blue line is enzyme without inhibitor or cofactors and the green line is enzyme with cofactors that help increase the reaction rate. Usually the cofactors bound tightly to the enzyme or strands somewhere along the enzyme and help with reactions and catalysis. Organic cofactors are called coenzymes.
