Buffer Lab: Biology Experiment on pH and Buffers
advertisement
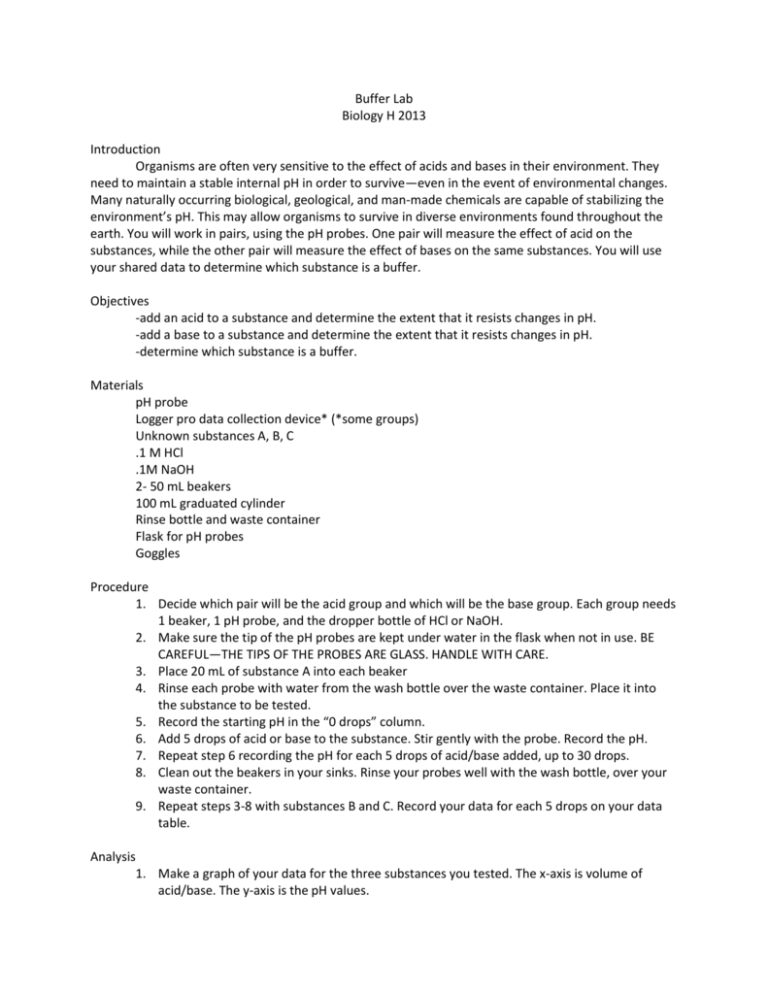
Buffer Lab Biology H 2013 Introduction Organisms are often very sensitive to the effect of acids and bases in their environment. They need to maintain a stable internal pH in order to survive—even in the event of environmental changes. Many naturally occurring biological, geological, and man-made chemicals are capable of stabilizing the environment’s pH. This may allow organisms to survive in diverse environments found throughout the earth. You will work in pairs, using the pH probes. One pair will measure the effect of acid on the substances, while the other pair will measure the effect of bases on the same substances. You will use your shared data to determine which substance is a buffer. Objectives -add an acid to a substance and determine the extent that it resists changes in pH. -add a base to a substance and determine the extent that it resists changes in pH. -determine which substance is a buffer. Materials pH probe Logger pro data collection device* (*some groups) Unknown substances A, B, C .1 M HCl .1M NaOH 2- 50 mL beakers 100 mL graduated cylinder Rinse bottle and waste container Flask for pH probes Goggles Procedure 1. Decide which pair will be the acid group and which will be the base group. Each group needs 1 beaker, 1 pH probe, and the dropper bottle of HCl or NaOH. 2. Make sure the tip of the pH probes are kept under water in the flask when not in use. BE CAREFUL—THE TIPS OF THE PROBES ARE GLASS. HANDLE WITH CARE. 3. Place 20 mL of substance A into each beaker 4. Rinse each probe with water from the wash bottle over the waste container. Place it into the substance to be tested. 5. Record the starting pH in the “0 drops” column. 6. Add 5 drops of acid or base to the substance. Stir gently with the probe. Record the pH. 7. Repeat step 6 recording the pH for each 5 drops of acid/base added, up to 30 drops. 8. Clean out the beakers in your sinks. Rinse your probes well with the wash bottle, over your waste container. 9. Repeat steps 3-8 with substances B and C. Record your data for each 5 drops on your data table. Analysis 1. Make a graph of your data for the three substances you tested. The x-axis is volume of acid/base. The y-axis is the pH values. 2. How should the pH of a material to test in each beaker compare before the acid or base is added? 3. Does your team’s data support your answer? If not, what are possible causes of the differences you measured? 4. Generally, what is the effect of adding HCl to each solution? What this true for each solution? If not, why not? 5. Generally, what is the effect of adding NaOH to each solution? What this true for each solution? If not, why not? 6. Which of the substances you tested is the buffer solution? Give evidence for your conclusion. 7. What are possible sources of error in this lab?
