pH Lab - Haiku Learning
advertisement
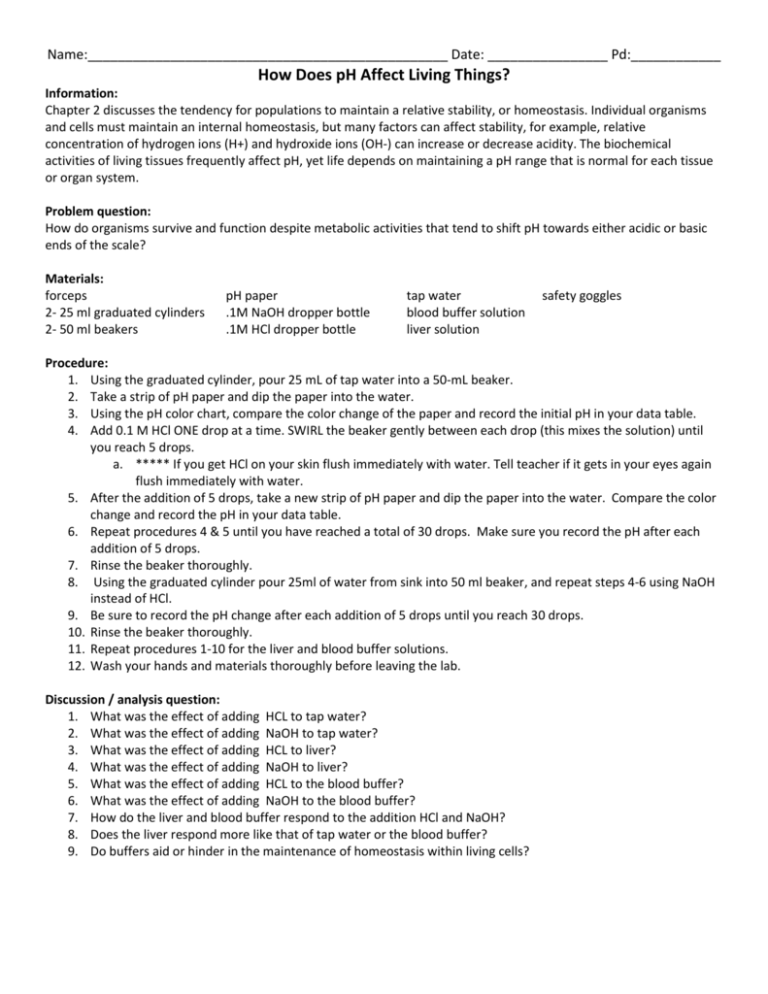
Name:________________________________________________ Date: ________________ Pd:____________ How Does pH Affect Living Things? Information: Chapter 2 discusses the tendency for populations to maintain a relative stability, or homeostasis. Individual organisms and cells must maintain an internal homeostasis, but many factors can affect stability, for example, relative concentration of hydrogen ions (H+) and hydroxide ions (OH-) can increase or decrease acidity. The biochemical activities of living tissues frequently affect pH, yet life depends on maintaining a pH range that is normal for each tissue or organ system. Problem question: How do organisms survive and function despite metabolic activities that tend to shift pH towards either acidic or basic ends of the scale? Materials: forceps 2- 25 ml graduated cylinders 2- 50 ml beakers pH paper .1M NaOH dropper bottle .1M HCl dropper bottle tap water blood buffer solution liver solution safety goggles Procedure: 1. Using the graduated cylinder, pour 25 mL of tap water into a 50-mL beaker. 2. Take a strip of pH paper and dip the paper into the water. 3. Using the pH color chart, compare the color change of the paper and record the initial pH in your data table. 4. Add 0.1 M HCl ONE drop at a time. SWIRL the beaker gently between each drop (this mixes the solution) until you reach 5 drops. a. ***** If you get HCl on your skin flush immediately with water. Tell teacher if it gets in your eyes again flush immediately with water. 5. After the addition of 5 drops, take a new strip of pH paper and dip the paper into the water. Compare the color change and record the pH in your data table. 6. Repeat procedures 4 & 5 until you have reached a total of 30 drops. Make sure you record the pH after each addition of 5 drops. 7. Rinse the beaker thoroughly. 8. Using the graduated cylinder pour 25ml of water from sink into 50 ml beaker, and repeat steps 4-6 using NaOH instead of HCl. 9. Be sure to record the pH change after each addition of 5 drops until you reach 30 drops. 10. Rinse the beaker thoroughly. 11. Repeat procedures 1-10 for the liver and blood buffer solutions. 12. Wash your hands and materials thoroughly before leaving the lab. Discussion / analysis question: 1. What was the effect of adding HCL to tap water? 2. What was the effect of adding NaOH to tap water? 3. What was the effect of adding HCL to liver? 4. What was the effect of adding NaOH to liver? 5. What was the effect of adding HCL to the blood buffer? 6. What was the effect of adding NaOH to the blood buffer? 7. How do the liver and blood buffer respond to the addition HCl and NaOH? 8. Does the liver respond more like that of tap water or the blood buffer? 9. Do buffers aid or hinder in the maintenance of homeostasis within living cells? Data Table: Solution tested tap water liver blood buffer Tests with 0.1M HCL pH after the addition of drops 0 5 10 15 20 25 30 0 Tests with 0.1M NaOH pH after the addition of drops 5 10 15 20 25 30 Graph: Prepare two graphs of pH versus the number of drops of acid or base. Plot a line for each solution tested on each graph.
