Name: 6.0 Biology Date:
advertisement
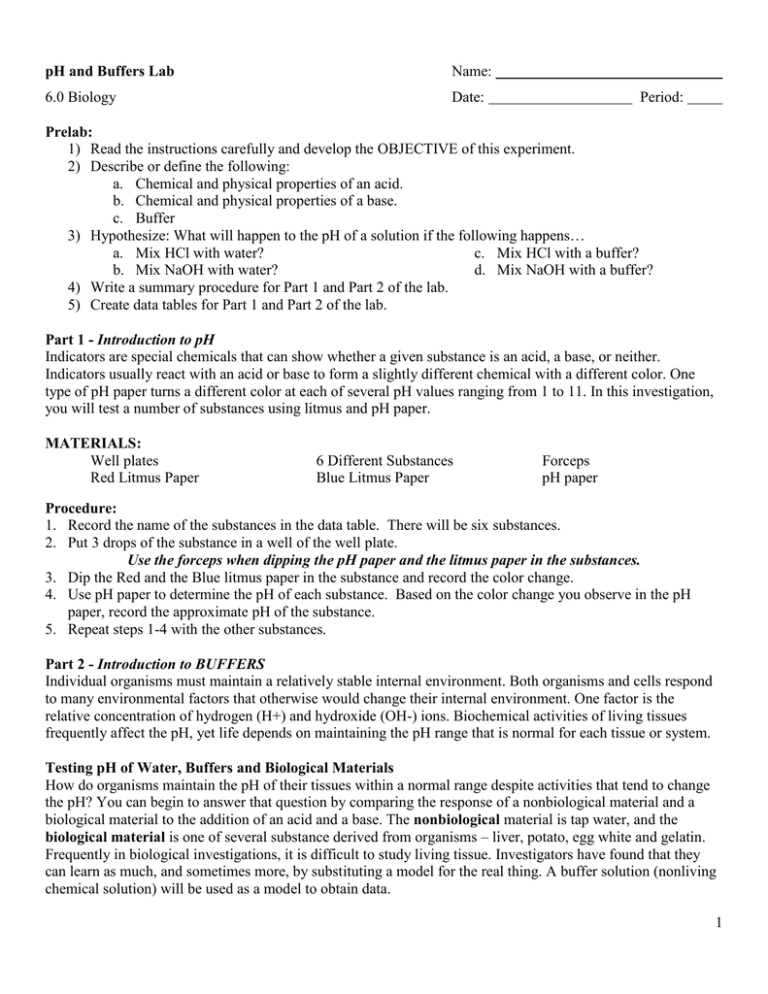
pH and Buffers Lab Name: 6.0 Biology Date: Period: Prelab: 1) Read the instructions carefully and develop the OBJECTIVE of this experiment. 2) Describe or define the following: a. Chemical and physical properties of an acid. b. Chemical and physical properties of a base. c. Buffer 3) Hypothesize: What will happen to the pH of a solution if the following happens… a. Mix HCl with water? c. Mix HCl with a buffer? b. Mix NaOH with water? d. Mix NaOH with a buffer? 4) Write a summary procedure for Part 1 and Part 2 of the lab. 5) Create data tables for Part 1 and Part 2 of the lab. Part 1 - Introduction to pH Indicators are special chemicals that can show whether a given substance is an acid, a base, or neither. Indicators usually react with an acid or base to form a slightly different chemical with a different color. One type of pH paper turns a different color at each of several pH values ranging from 1 to 11. In this investigation, you will test a number of substances using litmus and pH paper. MATERIALS: Well plates Red Litmus Paper 6 Different Substances Blue Litmus Paper Forceps pH paper Procedure: 1. Record the name of the substances in the data table. There will be six substances. 2. Put 3 drops of the substance in a well of the well plate. Use the forceps when dipping the pH paper and the litmus paper in the substances. 3. Dip the Red and the Blue litmus paper in the substance and record the color change. 4. Use pH paper to determine the pH of each substance. Based on the color change you observe in the pH paper, record the approximate pH of the substance. 5. Repeat steps 1-4 with the other substances. Part 2 - Introduction to BUFFERS Individual organisms must maintain a relatively stable internal environment. Both organisms and cells respond to many environmental factors that otherwise would change their internal environment. One factor is the relative concentration of hydrogen (H+) and hydroxide (OH-) ions. Biochemical activities of living tissues frequently affect the pH, yet life depends on maintaining the pH range that is normal for each tissue or system. Testing pH of Water, Buffers and Biological Materials How do organisms maintain the pH of their tissues within a normal range despite activities that tend to change the pH? You can begin to answer that question by comparing the response of a nonbiological material and a biological material to the addition of an acid and a base. The nonbiological material is tap water, and the biological material is one of several substance derived from organisms – liver, potato, egg white and gelatin. Frequently in biological investigations, it is difficult to study living tissue. Investigators have found that they can learn as much, and sometimes more, by substituting a model for the real thing. A buffer solution (nonliving chemical solution) will be used as a model to obtain data. 1 MATERIALS: 50 mL beaker 0.1 M HCl 0.1 M NaOH 50 mL graduated cylinder pH paper pH 7 buffer Tap water Liver homogenate Warm gelatin Egg white solution Potato homogenate CAUTION: 0.1 M HCl (hydrochloric acid) and 0.1 M NaOH (sodium hydroxide) are irritants. Avoid skin/eye contact; do NOT ingest. Notify teacher immediately. Flush spills and splash with water for 15 minutes; rinse mouth with water. PROCEDURE: 1. Pour 20 mL of tap water into a clean 50 mL beaker. Record the initial pH of the water. Place all used pH paper on a paper towel that can be thrown away at the end of lab. 2. Add 0.1 M hydrochloric acid (HCl) one drop at a time, swirling to mix after each drop. Record the new pH with a new strip of pH paper. 3. Continue to add in 3 drop increments and record the pH each time until 18 drops of HCl have been added. Swirl to mix and be sure to use new pH paper each time. 4. Empty contents into sink. Clean and rinse the beaker thoroughly. 5. Pour 20 mL of tap water into the clean beaker. Record the initial pH of the water. Add 0.1M sodium hydroxide (NaOH) drop by drop, swirling to mix after each drop. Record the new pH with a new strip of pH paper. 6. Continue to add in 3 drop increments and record the pH each time until 18 drops of NaOH have been added. Swirl to mix and be sure to use new pH paper each time. 7. Clean and rinse the beaker thoroughly. 8. Pour 20 mL buffer solution into the beaker. Record the initial pH of the buffer. Add HCl in 3 drop increments. Record the pH after each addition of 3 drops. Once you reach 18 drops, you may discard the solution. 9. Clean and rinse the beaker thoroughly. 10. Pour 20 mL of fresh buffer solution into the beaker. Record the initial pH of the buffer. Add NaOH in 3 drop increments. Record the pH after each addition of 3 drops. Once you reach 18 drops, you may discard the solution. 11. Obtain 20 mL the biological material assigned to your group by your teacher. Take the initial pH of the solution. Record the change in pH as you add 3 drop increments of HCl. Once you reach 18 drops, discard the biological material (any liquid can go into the sink, but solid material should be thrown away). 12. Clean and rinse beaker. 13. Obtain 20 mL of the same biological material. Take the initial pH of the solution. Record the change in pH as you add 3 drop increments of NaOH. Once you reach 18 drops, discard the biological material (any liquid can go into the sink, but solid material should be thrown away). 14. Clean all lab equipment and return materials to original location. Clean lab tables and wash your hands thoroughly before leaving the lab. 2 ANALYSIS Part 1 - Introduction to pH 1. 2. 3. 4. Which substance had the highest concentration of H+ ions? Give evidence to support your answer. Which substance is probably the strongest base? Give evidence to support your answer. What does it mean if a substance is considered neutral? List any substances that had a neutral pH. Use the data from the table to explain how red and blue litmus paper can be helpful in determining if a substance is an acid or base? 5. Predict what would happen if you were to mix together an acid and a base? Explain your answer. Part 2 - Introduction to BUFFERS Make a graph (on graph paper) of the changes in pH in tap water versus the number of drops of acid and base solutions added. Plot two lines - a solid line for changes with acid and a dashed line for changes with base. On the same graph, graph the results for your biological material. Use different colored solid (with acid) and dashed lines (with base) to represent changes in pH for the samples. On the same graph used for tap water and the biological material, graph the reaction of the buffer solution. Use a different colored solid (with acid) and dashed line (with base) for clarity. 1. 2. 3. 4. 5. 6. Summarize the effects of HCl and NaOH on tap water. What was the total pH change after 18 drops of HCl added to the biological material? What was the total pH change after 18 drops of NaOH was added to the biological material? How do these data compare with the changes in tap water? How do biological materials respond to changes in pH? How does the buffer system respond to HCl and NaOH? With respect to changes in pH, is the response of the buffer system more like that of water or of the biological material? 7. Would buffers aid or hinder the maintenance of a stable internal environment in a changing external environment? 3
