Cell Division
advertisement
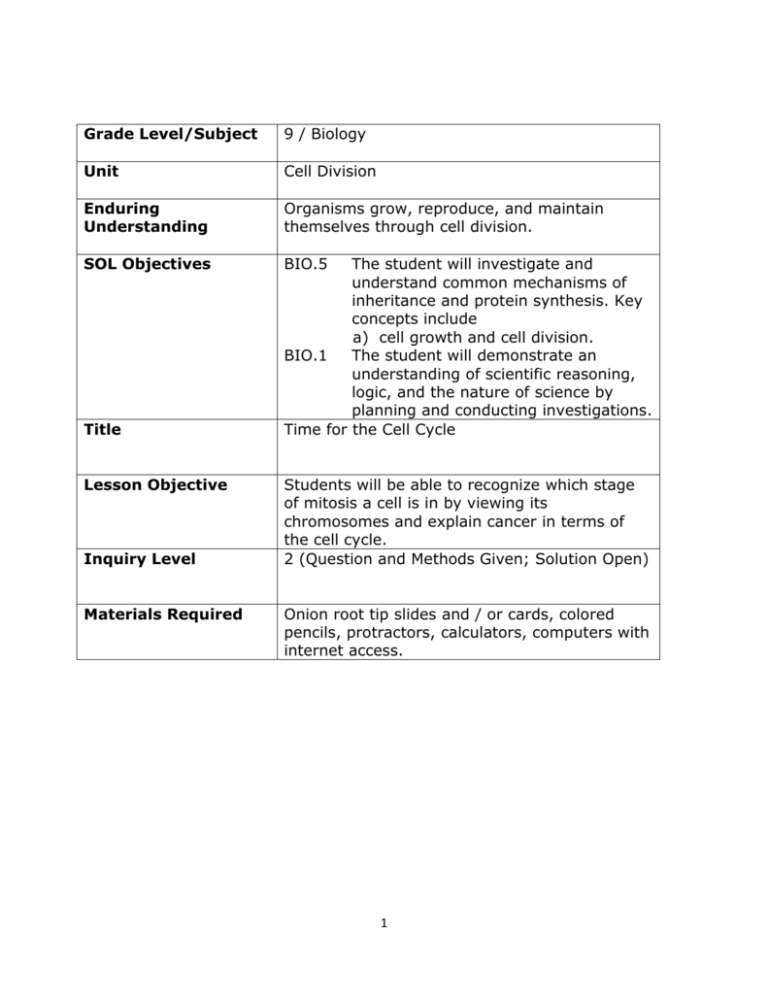
Grade Level/Subject 9 / Biology Unit Cell Division Enduring Understanding Organisms grow, reproduce, and maintain themselves through cell division. SOL Objectives BIO.5 Title Lesson Objective Inquiry Level Materials Required The student will investigate and understand common mechanisms of inheritance and protein synthesis. Key concepts include a) cell growth and cell division. BIO.1 The student will demonstrate an understanding of scientific reasoning, logic, and the nature of science by planning and conducting investigations. Time for the Cell Cycle Students will be able to recognize which stage of mitosis a cell is in by viewing its chromosomes and explain cancer in terms of the cell cycle. 2 (Question and Methods Given; Solution Open) Onion root tip slides and / or cards, colored pencils, protractors, calculators, computers with internet access. 1 The Time for the Cell Cycle Problem: How long do cells spend in each phase of the cell cycle? Objectives: 1. Identify the phases of the cell cycle 2. Determine the amount of time a cell spends in each part of the cell cycle 3. Compare normal cells to cancerous cells; specifically, determine the percentage of time a normal cell spends actively dividing compared to the percentage of time a cancerous cell spends actively dividing. Materials: 1. 2. 3. 4. 5. 6. Slides or photo cards of onion root tip cells in mitosis Lab handout Colored pencils Protractor Calculator Computers with internet access Part I – The Cell Cycle in the Onion Root Tip The root tip of an onion (or pretty much any plant, for that matter) contains a region of actively dividing cells called the apical meristem. This is the area in which cells divide, ultimately leading to what is called the plant’s primary (up and down) growth. Procedure: 1. Each person will receive a slide or a 3x5 card with a “photograph” of several onion root tip cells. If you get the 3 x 5 card, the images here are similar to what you would see if you were looking at this under a microscope. 2. Count the number of cells that are in each phase of the cell cycle (for the purposes of this investigation, consider the following phases: interphase, prophase, metaphase, anaphase, and telophase) 2 3. Record your data in data table I. 4. Combine your counts with the other students at your table so you can share class data. 5. Record the class data in data table II. 6. Follow the directions below the data table for calculating the percentage of time each phase takes in the overall cell cycle. Data Table I Interphase Prophase Metaphase Anaphase Telophase # of cell on YOUR card # of cells at your TABLE Data Table II Interphase Prophase Metaphase Anaphase # of cells – class data Fraction of cells spent in this phase (write as a decimal) Percent of time in this phase Number of degrees in a circle graph for this phase * Look on the next page for directions regarding how to make these calculations. 3 Telophase Total # of cells Directions for calculations (using class data): 1. Add up ALL of the cells in all of the phases and record the total in the total box. 2. Place the number of cells in a particular phase over (to make a fraction) the total number of cells counted. Divide the top number (the number in a particular phase) by the bottom number (the total number of cells), and write this in the “Fraction” box. 3. Multiply the decimal number from the previous step by 100 to get the percent of time and write this in the “percent” box. 4. Multiply the decimal from the “fraction” box by 360 to get the number of degrees in a circle graph that percent takes up and write it in the “number of degrees” box. 5. Using the circle graph attached to this lab and a protractor, measure out the appropriate number of degrees for each phase. Shade each section a different color and make sure to color in the boxes on the key. 6. Don’t forget a title for this graph! Questions: 1. In which phase of the cell cycle does the cell spend the most time?______________ 2. In which phase of the cell cycle does the cell spend the least time?_________________ 3. EXPLAIN how / why a slide of stained cells can be used to estimate how much time a living cell spends in each phase of the cell cycle. 4. You observed the cell cycle in a plant cell in this laboratory. How would the division of the cytoplasm appear in an animal cell? 4 The circle graph below has been divided into twelve sections, each measuring 30 degrees. You can use these lines as a reference when measuring out the specific degrees that you need to accurately represent each phase of the cell cycle below. Remember to give this graph a title and include a key showing which color represents which phase of the cell cycle. Title: _______________________________________________________________________________ 5 Part II – Cancer and the Cell Cycle Normally, the cell cycle has a system of checks and balances to make sure that cells are dividing at the appropriate rate. Sometimes, for a number of reasons, those checks and balances fail. When this happens, and a cell begins to divide uncontrollably, that cell has become cancerous. The figure at the right illustrates some of the most common differences between normal cells and cancerous cells. In the next portion of this investigation, you will utilize an online simulation to view differences in the rate of cell division between normal cells and those that have become cancerous. Procedure: 1. Go to: http://www.glencoe.com/sites/common_assets/advanced_placement/mader10e/virtual_la bs_2K8/labs/BL_03/ 2. Click on the Monitor to watch a short video on the cell cycle. 3. Click on the Information button in the lower right to get some background on cancer. 4. Click on the Microscope and examine all six slides (Lung – normal and cancerous, Stomach – normal and cancerous, Ovary – normal and cancerous). 5. For each slide, label the indicated cells using the drag and drop labels. Then check your work and record the data for _every_ cell on the slide (not just the few that you labeled) in the data table by clicking the Data Table button in the virtual lab. 6. For each slide, calculate the percentage of cells that are dividing and the percentage that are at rest (this should add up to 100%). Record this in the data table as well. 7. After you have examined all six slides, click on the Journal button and answer the three questions there. 8. Follow your teacher’s directions as to whether you should submit your work electronically (by clicking the Submit button in both the Data Table and the Journal and entering your email address and your teacher’s email address; note: you have to submit each of these items separately) or print out a hard copy to attach to this lab and turn in. 6
