File - Andrew Pany`s E
advertisement
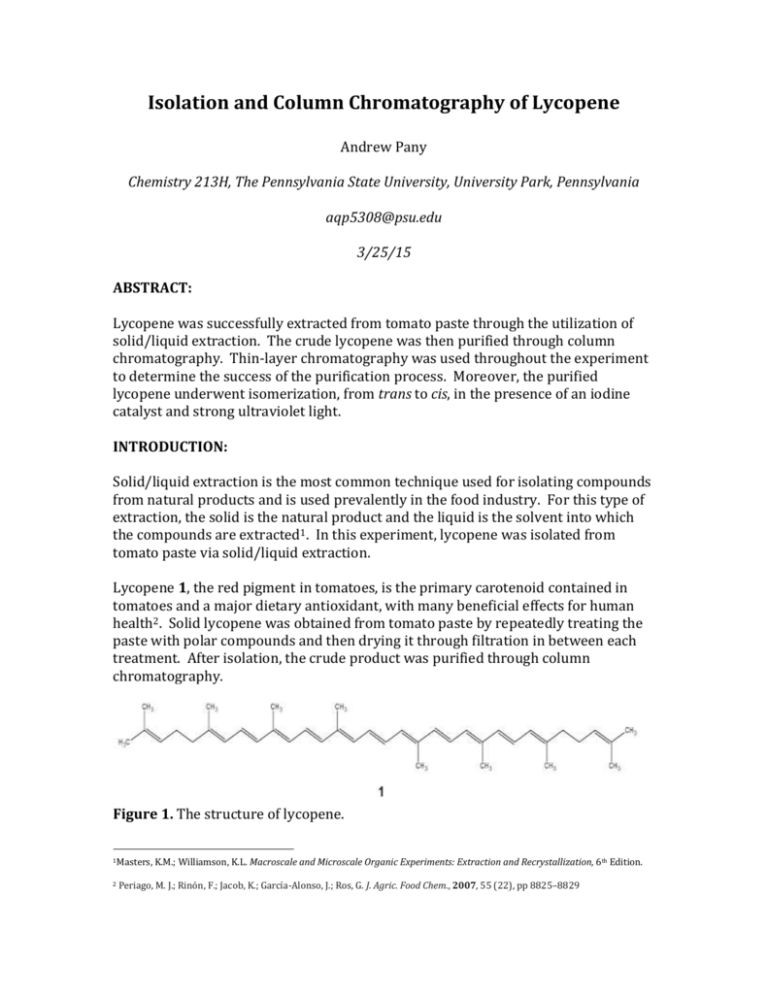
Isolation and Column Chromatography of Lycopene Andrew Pany Chemistry 213H, The Pennsylvania State University, University Park, Pennsylvania aqp5308@psu.edu 3/25/15 ABSTRACT: Lycopene was successfully extracted from tomato paste through the utilization of solid/liquid extraction. The crude lycopene was then purified through column chromatography. Thin-layer chromatography was used throughout the experiment to determine the success of the purification process. Moreover, the purified lycopene underwent isomerization, from trans to cis, in the presence of an iodine catalyst and strong ultraviolet light. INTRODUCTION: Solid/liquid extraction is the most common technique used for isolating compounds from natural products and is used prevalently in the food industry. For this type of extraction, the solid is the natural product and the liquid is the solvent into which the compounds are extracted1. In this experiment, lycopene was isolated from tomato paste via solid/liquid extraction. Lycopene 1, the red pigment in tomatoes, is the primary carotenoid contained in tomatoes and a major dietary antioxidant, with many beneficial effects for human health2. Solid lycopene was obtained from tomato paste by repeatedly treating the paste with polar compounds and then drying it through filtration in between each treatment. After isolation, the crude product was purified through column chromatography. Figure 1. The structure of lycopene. 1Masters, 2 K.M.; Williamson, K.L. Macroscale and Microscale Organic Experiments: Extraction and Recrystallization, 6th Edition. Periago, M. J.; Rinón, F.; Jacob, K.; García-Alonso, J.; Ros, G. J. Agric. Food Chem., 2007, 55 (22), pp 8825–8829 Column chromatography is one of the most useful methods for the separation and purification of solids in microscale experiments (experiments dealing with 10 grams or less). This purification process takes advantage of the differences in the elution rates of the desired product and contaminates through the utilization of adsorbents, such as silica gel [(SiO2)x] or aluminum [(Al2O3)x], and solvents (usually hexanes)3. Less polar molecules are not strongly adsorbed and travel through the column quickly, while more polar molecules are strongly adsorbed and travel through the column slowly. Additionally, both the purified and crude lycopene products were analyzed via thinlayer chromatography (TLC). Thin-layer chromatography is a sensitive, fast, simple, and inexpensive analytical technique used to determine the number of components in a mixture, the effectiveness of a purification process, and monitor reaction progress, among other functions. TLC, similarly to column chromatography, takes advantage of the differences in elution rates of various substances4. Substances that are like the stationary phase, mostly in polarity, will travel slowly and short distances. Substances that are unlike the stationary phase will travel fast and extended distances. These differences allow chemists to determine the identities of substances. Furthermore, some of purified lycopene product underwent light-catalyzed isomerization, using iodine as an added catalyst. Both the isomerized and unisomerized portions of lycopene were characterized via UV-visual spectrophotometry. The objectives of this experiment were to isolate lycopene from tomato paste via solid/liquid extraction, purify the lycopene mixture via column chromatography, and to isomerize the lycopene using iodine as a catalyst. RESULTS AND DISCUSSIONS: Solid/Liquid Extraction of Lycopene Tomato paste was initially rinsed with acetone and pressed dry before undergoing the solid/liquid extraction to help remove water-soluble components from the paste. The filtrate from the pressing was saved. The solid residue was then shaken with dichloromethane and filtered, both done three times. Following completion, all of the filtrates were combined. Water and sodium chloride were added to the filtrate solution to aid in the breaking of emulsions. Once the two additional components were added, the solution began to separate into two layers. A yellow, top layer formed over an orange, bottom layer. The extraction removed the acetone and any water-soluble components from the mixture, which were contained in the yellow layer. What remained was the 3Masters, 4 K.M.; Williamson, K.L. Macroscale and Microscale Organic Experiments: Extraction and Recrystallization, 6th Edition. Masters, K.M.; Williamson, K.L. Macroscale and Microscale Organic Experiments: Extraction and Recrystallization, 6th Edition. orange organic layer, which contained the crude lycopene still suspended in dichloromethane. The orange solution was subsequently dried over anhydrous calcium chloride and filtered. A portion of this filtrate was analyzed by thin-layer chromatography while most of the product was evaporated and stored under nitrogen since the carotenoids are very susceptible to air oxidation. The TLC analysis gave Rf values of .241 and .769, indicating a mixture of two products. The first value represents the desired lycopene while the second value indicates a strong presence of carotene, which is also contained in the tomato paste and is a byproduct of the extraction in this experiment. Column Chromatography of Lycopene The crude lycopene product obtained from extraction was purified through column chromatography. The chromatography column was prepared via a dry-packing method, running an 80:20 hexane to water mixture through the column packed with silica. Sample from the extraction was then added in a dichloromethane solution to the chromatography column followed by a layer of sand packed on top of the sample. Hexanes were run through the column continuously, causing the formation of a yellow and orange band as the sample traveled through the column. The two bands were separately collected and the submitted for thin-layer chromatography. The TLC analysis showed an Rf value of .648 for the yellow band. This value closely matches that of pure carotene. The TLC analysis for the orange band showed a value of .16, which is very similar to that of pure lycopene. These values indicate that the purification was a success. Isomerization of Lycopene A hexane solution of a portion of the lycopene was prepared for isomerization by adding a drop of iodine catalyst. The resulting mixture was exposed to strong ultraviolet light for ten minutes in order to change from a trans-isomer to a cisisomer. Both a solution of nonisomerized and isomerized lycopene were submitted ultraviolet-visible spectrum analysis. The unisomerized lycopene had strong absorptions at 448.10nm, 472.30, nm, and 504.40nm. The isomerized lycopene had strong absorptions at 443.00, 466.20, and 498.90. The spectral data verifies that the isomerization was successful since it shows the presence of a hypochromic effect, a decrease in the visible-band absorption that typically occurs when a trans-isomer changes to a cis-isomer. The spectral data also confirms the presence of a hypsochromic shift, a shift to the left, usually by five to seven nanometers, of the peaks in the visible-band absorption5. 5 Tan, B; Soderstrom, D. N. J. Chem. Educ., 1989, 66 (3), p 258 CONCLUSION: Solid/liquid extraction was successfully used to isolate a lycopene mixture from tomato paste. Additionally, column chromatography was successfully used to purify the mixture, yielding pure carotene and lycopene. The success of the purification process in addition to the presences of both substances was confirmed by thin-layer chromatography. Through the use of ultraviolet light and an iodine catalyst, the lycopene was effectively isomerized from a trans-isomer to a cis-isomer, which was confirmed by ultraviolet-visible spectrum analysis. ACKNOWLEDGEMENTS: The author would like to graciously acknowledge the support from the class professor, Dr. Masters, and teaching assistant Anthony Nocket. REFRENCES: 1. Masters, K.M. Chem 213H Food Science Module, Spring 2015. 2. Masters, K.M.; Williamson, K.L. Macroscale and Microscale Organic Experiments: Extraction and Recrystallization, 6th Edition. 3. Periago, M. J.; Rinón, F.; Jacob, K.; García-Alonso, J.; Ros, G. J. Agric. Food Chem., 2007, 55 (22), pp 8825–8829 4. Tan, B; Soderstrom, D. N. J. Chem. Educ., 1989, 66 (3), p 258 SUPPORTING DATA: Please see attached sheets.
