UV/VIS + Fluorescence
advertisement
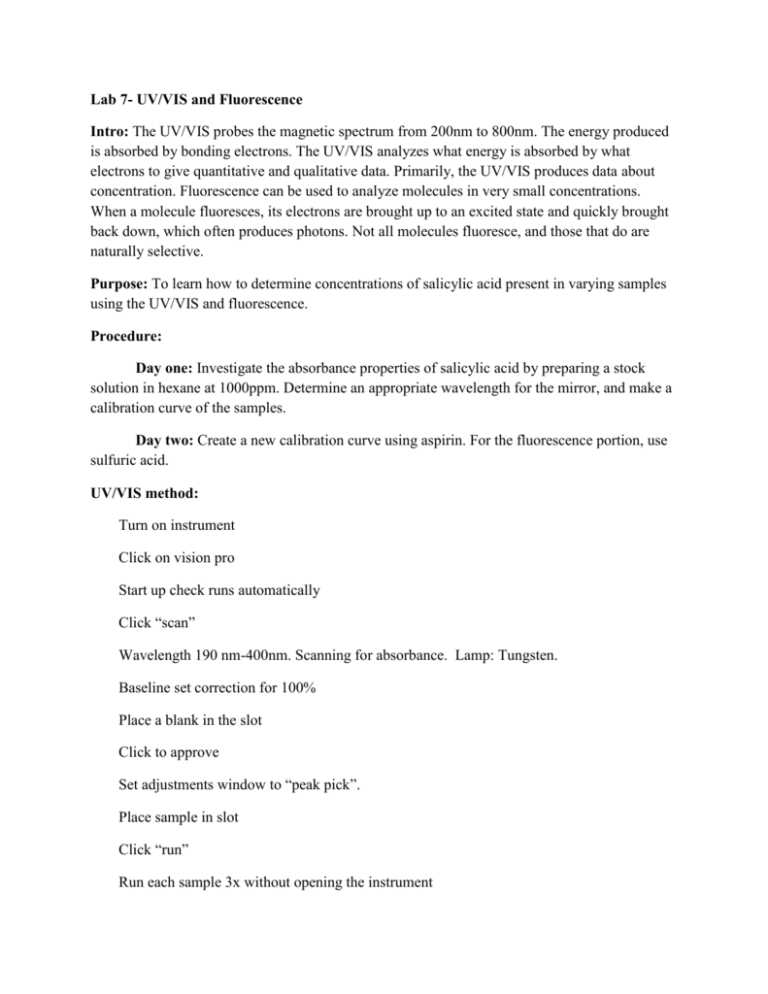
Lab 7- UV/VIS and Fluorescence Intro: The UV/VIS probes the magnetic spectrum from 200nm to 800nm. The energy produced is absorbed by bonding electrons. The UV/VIS analyzes what energy is absorbed by what electrons to give quantitative and qualitative data. Primarily, the UV/VIS produces data about concentration. Fluorescence can be used to analyze molecules in very small concentrations. When a molecule fluoresces, its electrons are brought up to an excited state and quickly brought back down, which often produces photons. Not all molecules fluoresce, and those that do are naturally selective. Purpose: To learn how to determine concentrations of salicylic acid present in varying samples using the UV/VIS and fluorescence. Procedure: Day one: Investigate the absorbance properties of salicylic acid by preparing a stock solution in hexane at 1000ppm. Determine an appropriate wavelength for the mirror, and make a calibration curve of the samples. Day two: Create a new calibration curve using aspirin. For the fluorescence portion, use sulfuric acid. UV/VIS method: Turn on instrument Click on vision pro Start up check runs automatically Click “scan” Wavelength 190 nm-400nm. Scanning for absorbance. Lamp: Tungsten. Baseline set correction for 100% Place a blank in the slot Click to approve Set adjustments window to “peak pick”. Place sample in slot Click “run” Run each sample 3x without opening the instrument Repeat steps 10-12 until finished running samples Exit program, and turn off instrument Fluorescence method: Turn on computer and instrument Click “PX-150x” Click Configure -> PC Configure -> first portal If box in bottom right is off, click “configure”, “instrument”, then “on” Click “acquire” and “spectrum” Fill cuvette ¾ full with least concentrated standard. Scan Click “search wavelengths” Range for excitation and emission 230-450 and 230-650 Click “search” Run that stuff UV/VIS data: Absorbance of Unknowns Samples at 236nm Trial 1 Trial 2 0.555 0.546 Trial 3 0.530 Average: 0.543 Concentration Vs. Absorbance For Salicylic Acid At 240nm 1.8 1.6 Absorbance 1.4 1.2 1 0.8 y = 0.0181x + 0.2323 R² = 0.978 0.6 0.4 0.2 0 0 10 20 30 40 50 Concentration Continued below. Big chart! 60 70 80 90 Absorbance Values for Standard Concentrations (ppm) Of Salicylic Acid at 240nm Absorbance Concentration 10 0.379 10 0.37 10 0.372 20 0.587 20 0.587 20 0.583 30 0.77 30 0.771 30 0.758 40 1.025 40 1.02 40 1.004 50 1.107 50 1.113 50 1.102 60 1.427 60 1.441 60 1.416 80 1.602 80 1.598 80 1.588 UV/VIS calculations: Sample concentrations were diluted using M1V1=M2V2 formula. Ex: (1000ppm)(x) = (10ppm)(25mL) x = 0.25 mL Unknown data was calculated using the slope of the calibration curve and the average of the unknown sample absorption. Ex: 0.543 = 0.0181 (x) + 0.2323 x = 17.1657ppm Fluorescence data: Standard Concentrations of Quinine at 250nm Concentrations (ppm) Absorbance 0.1 2.477 1 2.491 1 2.4889 5 3.006 5 3.006 10 3.006 10 3.006 Absorbance of Quinine if Unknown sample at 508nm Trial 1 3.006 Trial 2 3.006 Trial 3 3.006 Standard Concentration Vs. Absorbance Of Quinine at Approx. 250nm 3.5 3 y = 0.058x + 2.5172 R² = 0.7581 Absorbanc 2.5 2 Series1 1.5 Linear (Series1) 1 0.5 0 0 2 4 6 8 10 12 Concentration (ppm) Fluorescence calculations: All calculations use same procedure and formulas as stated in the UV/VIS portion of the lab. Ex: (3.006) = 0.058 x + 2.5172 x = 8.4258ppm Conclusion: We determined the unknown SA concentration to be 17.165ppm. On our calibration curve, there was a 97.8% correlation with the line of best fit and the absorbance at 240nm, indicating our curve was very accurate. This is good, considering we did not run the 70ppm sample due to time constraints. The unknown concentration of quinine was 8.4258ppm. the fluorescence portion of the lab was not as accurate, because our calibration curve was not as consistent. The 5ppm sample suddenly spiked for unknown reasons. We believe it may be due to contamination or instrumental error. It may be that the instrument does not measure concentrations higher than 5ppm, because all absorbance points after this are the same. Next time, we will further dilute the samples to avoid this error and test our hypothesis.
