Quant expt 6
advertisement
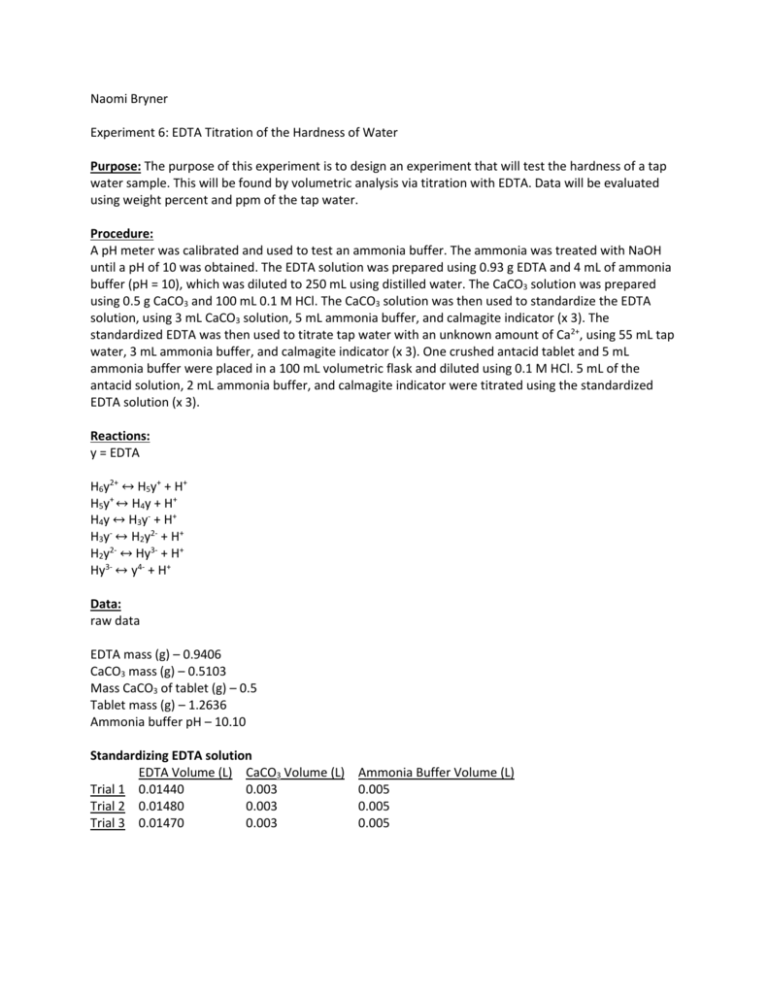
Naomi Bryner Experiment 6: EDTA Titration of the Hardness of Water Purpose: The purpose of this experiment is to design an experiment that will test the hardness of a tap water sample. This will be found by volumetric analysis via titration with EDTA. Data will be evaluated using weight percent and ppm of the tap water. Procedure: A pH meter was calibrated and used to test an ammonia buffer. The ammonia was treated with NaOH until a pH of 10 was obtained. The EDTA solution was prepared using 0.93 g EDTA and 4 mL of ammonia buffer (pH = 10), which was diluted to 250 mL using distilled water. The CaCO3 solution was prepared using 0.5 g CaCO3 and 100 mL 0.1 M HCl. The CaCO3 solution was then used to standardize the EDTA solution, using 3 mL CaCO3 solution, 5 mL ammonia buffer, and calmagite indicator (x 3). The standardized EDTA was then used to titrate tap water with an unknown amount of Ca2+, using 55 mL tap water, 3 mL ammonia buffer, and calmagite indicator (x 3). One crushed antacid tablet and 5 mL ammonia buffer were placed in a 100 mL volumetric flask and diluted using 0.1 M HCl. 5 mL of the antacid solution, 2 mL ammonia buffer, and calmagite indicator were titrated using the standardized EDTA solution (x 3). Reactions: y = EDTA H6y2+ ↔ H5y+ + H+ H5y+ ↔ H4y + H+ H4y ↔ H3y- + H+ H3y- ↔ H2y2- + H+ H2y2- ↔ Hy3- + H+ Hy3- ↔ y4- + H+ Data: raw data EDTA mass (g) – 0.9406 CaCO3 mass (g) – 0.5103 Mass CaCO3 of tablet (g) – 0.5 Tablet mass (g) – 1.2636 Ammonia buffer pH – 10.10 Standardizing EDTA solution EDTA Volume (L) CaCO3 Volume (L) Trial 1 0.01440 0.003 Trial 2 0.01480 0.003 Trial 3 0.01470 0.003 Ammonia Buffer Volume (L) 0.005 0.005 0.005 Tap H2O titration with EDTA EDTA Volume (L) Ammonia Buffer Volume (L) Trial 1 0.0520 0.003 Trial 2 0.0530 0.003 Trial 3 0.0520 0.003 Tap H2O Volume (L) 0.055 0.055 0.055 Tablet solution titration with EDTA EDTA Volume (L) Ammonia Buffer Volume (L) Trial 1 0.01001 0.002 Trial 2 0.01229 0.002 Trial 3 0.00780 0.002 Antacid Solution Volume (L) 0.005 0.005 0.005 treated data Concentration EDTA (M) Trial 1 0.0106 Trial 2 0.0103 Trial 3 0.0104 Average 0.0104 Concentration Ca2+ (M) 0.00216 0.00276 0.00216 0.00236 Hardness of water (ppm) 86.6 111 86.6 94.7 Calculations: Mass EDTA needed Molar Mass EDTA × Desired Molarity × Desired 1 mol 292.14 g × 0.01 M × 0.25 L = 0.730 g 1 mol Volume Concentration of EDTA 1 mol 1 × × Volume Used Molar mass CaCO3 Dilution Volume 1 mol 1 1 × × 0.003 L × = 0.0106 M 100.09 g 0.1 L 0.01440 L mass CaCO3 × 0.5103 g × Ca2+ concentration in tap H2O 1 mol Ca2+ 1 × Dilution Volume 1 mol EDTA 1 mol Ca2+ 1 × 0.25 L = 0.00216 M Ca2+ 1 mol EDTA Volume EDTA × Molarity EDTA × 0.0520 L × 0.0104 M × Hardness of Water Molar mass Ca2+ 1000 mg × 1 mol 1g 40.078 g 1000 mg × 1 g = 86.6 ppm 1 mol Molarity Ca2+ × 0.00216 M × Reported antacid Ca2+ content 1 mol 1 mol Ca2+ Molar mass Ca2+ × × Molar mass CaCO3 1 mol CaCO3 1 mol 1 mol 1 mol Ca2+ 40.078 g × 1 mol CaCO × 1 mol = 0.200 g Ca2+ 100.09 g 3 mass CaCO3 × 0.5005 g × × 1 Volume EDTA Tablet Ca2+ Content (g) 0.0834 0.102 0.0650 0.0835 Weight percent Ca2+ (reported) Mass Ca2+ Mass tablet 0.200 𝑔 × 1.2636 𝑔 × 100 % 100 % = 15.8% Experimental antacid Ca2+content 1 𝑚𝑜𝑙 𝐶𝑎 2+ 𝑚𝑜𝑙𝑎𝑟 𝑚𝑎𝑠𝑠 𝐶𝑎 2+ 20 𝑝𝑎𝑟𝑡𝑠 × × 𝑠𝑜𝑙𝑢𝑡𝑖𝑜𝑛 1 𝑚𝑜𝑙 𝐸𝐷𝑇𝐴 1 𝑚𝑜𝑙 𝐶𝑎 2+ 1 𝑚𝑜𝑙 𝐶𝑎 2+ 40.078 𝑔 20 𝑝𝑎𝑟𝑡𝑠 × × = 0.0834 g 1 𝑚𝑜𝑙 𝐸𝐷𝑇𝐴 1 𝑚𝑜𝑙 𝐶𝑎 2+ 𝑠𝑜𝑙𝑢𝑡𝑖𝑜𝑛 Volume EDTA × 𝑀𝑜𝑙𝑎𝑟𝑖𝑡𝑦 𝐸𝐷𝑇𝐴 × 0.01001 L × 0.0104 𝑀 × Weight Percent Ca2+ (experimental) Mass Ca2+ Mass tablet 0.0835 𝑔 × 1.2636 𝑔 × 100 % 100 % = 6.61% Difference of weight percent Reported percent – experimental percent 15.8% - 6.61% = 9.91% Conclusion: The hardness of water was determined via Ca2+ content in tap water. The average hardness of tap water was determined to be 94.7 ppm, which is considered moderately hard by the United States Geological Survey. Calcium content was evaluated in an antacid and compared to the manufacturer’s claim. A difference of 9.91% was found to exist between the experimental and reported weight percentage of calcium per tablet. The difference is rather high, which could indicate that errors occurred in this part of the experiment.
